How to implement Multivariable Regression in Python
Regression is a statistical method used in finance, investing, and other disciplines that attempts to determine the strength and character of the relationship between one dependent variable and a series of other variables(independent variables).
Multivariable Regression is a Machine Learning algorithm that helps establish the relationship between a dependent variable and more than one independent variable.
Multivariable regression can be used for a variety of different research purposes.
In order to find the relationship between the dependent and independent variable using Python:
First, you need to import the statements. Right now, we need to import pandas, numpy, and matplotlib. To visualize the data, the following modules are used:
-
import pandas- used for open-source data analysis and manipulation tools. -
import numpy- used for a general-purpose, array processing package. It provides a multidimensional performance array object. -
import matplotlib.pyplot- used for plotting the given data. -
from sklearn import linear_model- used for statistical modeling, including classification, regression, etc.
from mpl_toolkits.mplot3d import Axes3Dimport pandas as pdimport matplotlib.pyplot as pltimport numpy as npfrom sklearn import linear_modelnp.random.seed(19680801)
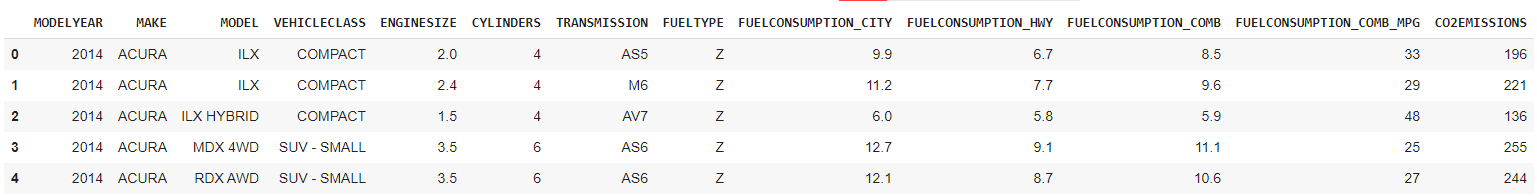
The second step is to read and retrieve data:
Fuel.csv is the name of the file where the data is stored. This file is then saved in the database.
First, we will retrieve the data using data.head(210) and work on the data:
data=pd.read_csv("Fuel.csv")
data.head(210)
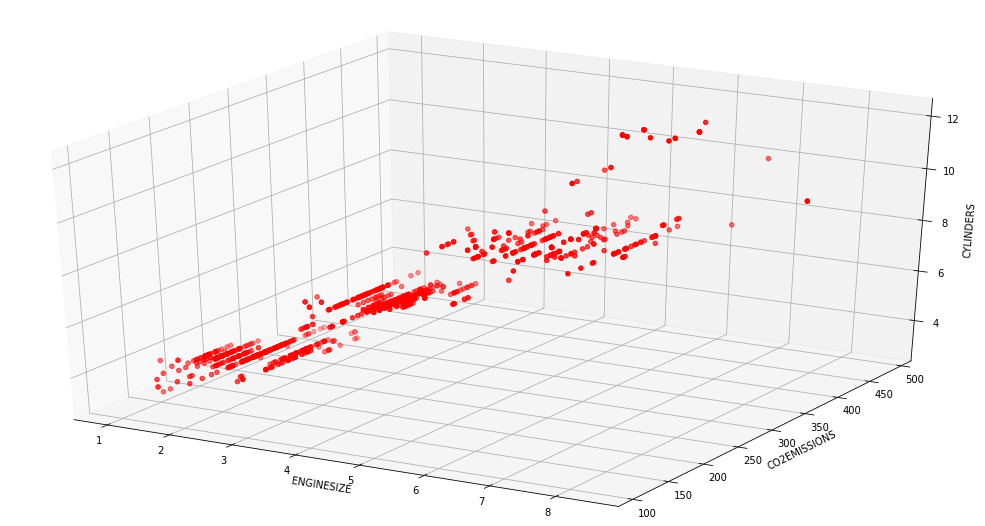
data = data[["ENGINESIZE","CO2EMISSIONS","CYLINDERS"]]
fig=plt.figure()ax=fig.add_subplot(111,projection='3d')n=100ax.scatter(data["ENGINESIZE"],data["CO2EMISSIONS"],data["CYLINDERS"],color="red")ax.set_xlabel("ENGINESIZE")ax.set_ylabel("CO2EMISSIONS")ax.set_zlabel("CYLINDERS")plt.show()
Then, we will train and test data from our data:
-
Train and test the data using the
trainandtestvariables (respectively). Only use 80% of the data for training. -
Print the coefficient and the intercept of the regression. We use the
sklearnpackage to model data that returns multivariable regression values.
#enerating training and testing data from our data:# We are using 80% data for training.train = data[:(int((len(data)*0.8)))]test = data[(int((len(data)*0.8))):]
# Modeling:# Using sklearn package to model data :regr = linear_model.LinearRegression()train_x = np.array(train[["ENGINESIZE"]])train_y = np.array(train[["CO2EMISSIONS"]])regr.fit(train_x,train_y)
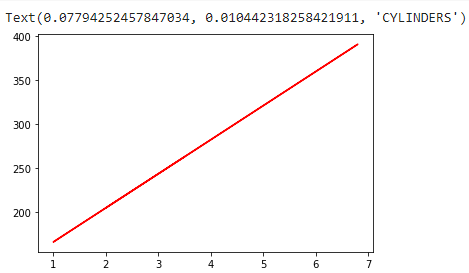
Next, we plot the regression line:
After training and testing, plot the values using plt as an abbreviation of matplotlib.pyplot, ax as an abbreviation for Axes3d, Xlabel as the x-axis label, and ylabel as the y-axis label. Then, choose the color you want to represent it with.
ax.scatter(data["ENGINESIZE"],data["CO2EMISSIONS"],data["CYLINDERS"],color="red")plt.plot(train_x, regr.coef_*train_x + regr.intercept_, '-r')ax.set_xlabel("ENGINESIZE")ax.set_ylabel("CO2EMISSIONS")ax.set_zlabel("CYLINDERS")
To find the coefficient and intercept
print ("coefficients : ",regr.coef_) #Slopeprint ("Intercept : ",regr.intercept_)
The output:
Intercept : [127.16989951]
Estimating the value of engine size
# Predicting values:# Function for predicting future valuesdef get_regression_predictions(input_features,intercept,slope):predicted_values = input_features*slope + interceptreturn predicted_values# Checking various accuracy:from sklearn.metrics import r2_scoretest_x = np.array(test[['ENGINESIZE']])test_y = np.array(test[['CO2EMISSIONS']])test_y_ = regr.predict(test_x)print("Mean absolute error: %.2f" % np.mean(np.absolute(test_y_ - test_y)))print("Mean sum of squares (MSE): %.2f" % np.mean((test_y_ - test_y)** 2))print("R2-score: %.2f" % r2_score(test_y_ , test_y) )
Output:
Mean absolute error: 20.60
Mean sum of squares (MSE): 746.45
R2-score: 0.71
RELATED TAGS
CONTRIBUTOR
- undefined by undefined
