How to create a scatter chart using matplotlib
A scatter plot is a type of plot that shows data as a collection of points. A point’s position depends on its two-dimensional value, where each value is positioned on either the horizontal or vertical dimension.
Matplotlib has a built-in function to create scatterplots called
scatter().
Syntax
Take a look at the syntax below:
matplotlib.pyplot.scatter(x, y, s=None, c=None, marker=None, ...)
x and y are the data points on the x and y-axis. The function also has several other optional parameters such as color, area, alpha values, etc.
Click here for further details.
Code
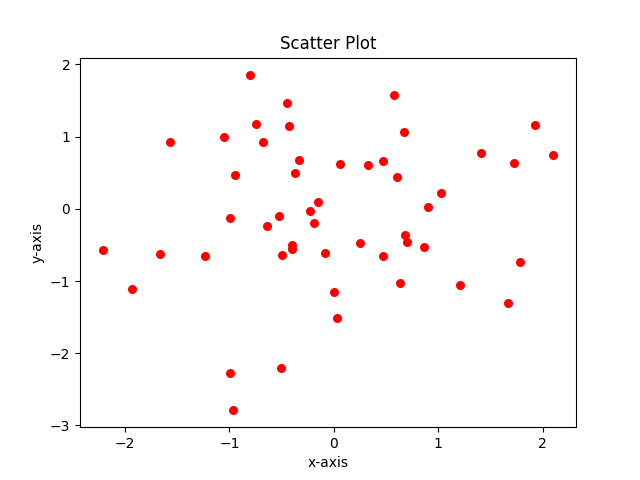
The example below outputs a scatter plot that consists of randomly generated data points:
import numpy as npimport matplotlib.pyplot as pltnum = 50x = np.random.rand(num)y = np.random.rand(num)# alpha value denotes the transparency. higher the value, more opaque the element is, visuallyplt.scatter(x, y, c='red', alpha=0.8)plt.title('Scatter plot')plt.xlabel('x-axis')plt.ylabel('y-axis')plt.show()
Free Resources
Copyright ©2026 Educative, Inc. All rights reserved