Multiple linear regression in Julia
Linear regression is a supervised machine learning algorithm used to determine the relationship between a dependent variable and one or more independent variables.
While simple linear regression involves determining the relationship between one dependent variable and one independent variable, multiple linear regression involves determining the relationship between one dependent variable and two or more independent variables. You can learn more about linear regression here.
In this Answer, we will be using linear regression to predict the price of a property in Boston.
Import libraries
Import the below libraries for use.
import PkgPkg.add("Lathe")Pkg.add("GLM")Pkg.add("StatsBase")Pkg.add("RDatasets")println("Packages successfully imported")
Lathe is a library used to split data into train and test sets, GLM contains important algorithms used for model training, StatsBase is used for model evaluation, while RDatasets contains sample datasets for use.
Load dataset
This dataset is found in the MASS category of RDatasets.
Import the dataset and obtain its size.
using RDatasetsdata = dataset("MASS","Boston")println("Size of the dataset is: ",size(data))println(first(data,5))
Size of the dataset and first 5 rows.


Data summary using describe()
View the data summary using describe.
describe(data)
Note: You can run the
describecommand in the code widget above.
Summary of the dataset:

")
As per the summary, the data contains no missing values and the data is either of integer or float type.
We could have considered applying one hot encoding to these columns or any other category encoder if we had any categorical features.
Splitting data and model training
The column MedV which stands for median value of a house is our target column. This column contains the house prices of houses in the Boston area.
Use the Lathe library to split the data and GLM to train the models as shown below.
using Lathe.preprocess: TrainTestSplit

train, test = TrainTestSplit(data, .80);

using GLM

fm = @formula(MedV ~ Crim + Zn + Indus + Chas + NOx + Rm + Age + Dis + Rad + Tax + PTRatio + Black + LStat)
linear_regressor = lm(fm, train)
Here is the model training output.
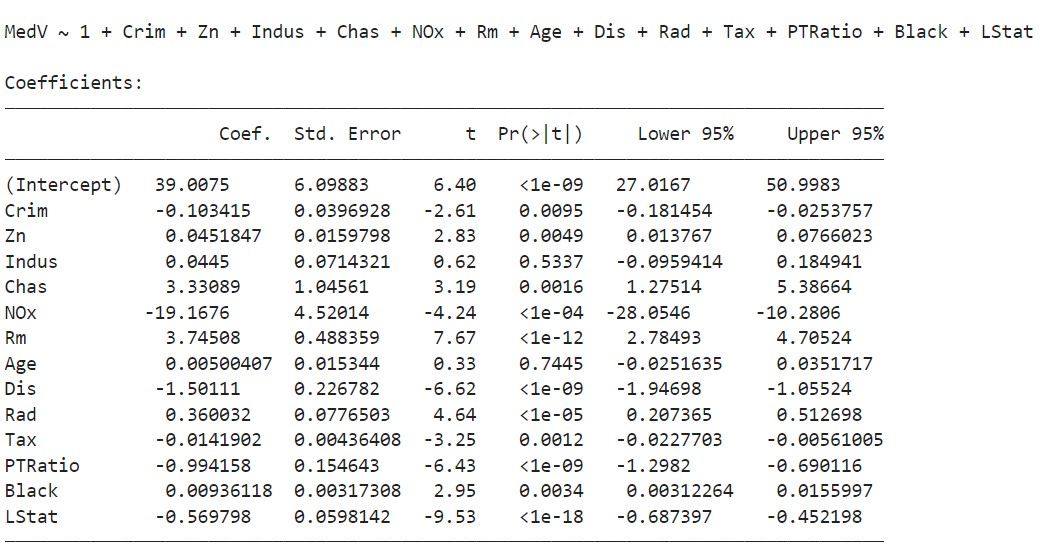
In linear regression, a feature is said to be statistically significant if the p-value shown on column 4 (Pr>|t|) is smaller than the level of significance, in this case 0.05.
Notice that some features such as Age and Indus are not significant in predicting house prices.
Model evaluation
Obtain R2 otherwise known as the co-efficient of determination as shown.
println("R2 for the linear regressor: ", r2(linear_regressor))
R2 for the linear regressor: 0.7343912552684675.
This is a good score and means our model is able to account for 73.4% of the variability in Prices.
Obtain the Mean Absolute Error as well to evaluate how well our model is predicting our test data.
This is done by first obtaining the predictions on our test set, having them in a dataframe for ease of comparison, then obtaining the error between predicted and actual values, and finally obtaining the mean absolute error.
This is as shown below.
using StatsBase
prediction = predict(linear_regressor, test);

accuracy_testdf = DataFrame(y_actual = test[!,:MedV], y_predicted = prediction)
accuracy_testdf.error = accuracy_testdf[!,:y_actual]

accuracy_testdf[!,:y_predicted]
println("Mean absolute error on test dataset: ",mean(abs.(accuracy_testdf.error)))
Mean absolute error on test dataset: 2.9687403653655355
This means our model is predicting within a margin error of 2.97 on average. This is good since it is a small margin.
Example
#Loading Datasetusing RDatasetsdata = dataset("MASS","Boston")#Splitting data and model trainingusing Lathe.preprocess: TrainTestSplittrain, test = TrainTestSplit(data, .80);using GLMfm = @formula(MedV ~ Crim + Zn + Indus + Chas + NOx + Rm + Age + Dis + Rad + Tax + PTRatio + Black + LStat)linear_regressor = lm(fm, train)#Model Evaluationprintln("R2 for the linear regressor: ", r2(linear_regressor))using StatsBaseprediction = predict(linear_regressor, test);accuracy_testdf = DataFrame(y_actual = test[!,:MedV], y_predicted = prediction)accuracy_testdf.error = accuracy_testdf[!,:y_actual]accuracy_testdf[!,:y_predicted]println("Mean absolute error on test dataset: ",mean(abs.(accuracy_testdf.error)))
Free Resources