What is a confusion matrix in machine learning?
The confusion matrix is a method to assess a classification model’s performance. It is a summary of classification problem prediction outcomes.
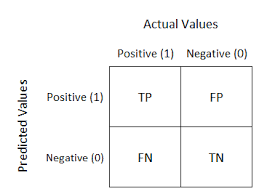
For example, let’s look at a binary classification problem. It is a 2 x 2 matrix split into two parts: actual values and predicted values.
The following can be deduced from the table above:
- The target variable can take either a positive or a negative value.
- The values of the target variable are represented in the columns.
- The rows represent the predicted values of the target variable.
The actual and predicted values can be further broken down into four parts:
- True positive (TP)
- True negative (TN)
- False Positive (FP)
- False Negative (FN)
Example
Let’s break this down. We will use the case of a cancer patient as an example, where 1 represents a cancer patient and 0 represents a cancer-free patient.
1. True Positive (TP)
True positive is when the predicted value matches the actual value in a positive way. It is when the actual value and the predicted value are positive. For example, the actual value of a patient is 1 and the predicted value is 1.
2. True Negative (TN)
True negative is when the predicted value matches the actual value in a negative way. It is when the actual value and the predicted value are negative. For example, the actual value of a patient is 0 and the predicted value is 0.
3. False Positive (FP)
A false positive is known as the Type-1 error. It is when the actual value is negative and the predicted value is positive. For example, the actual value of a patient is 0 and the predicted value is 1.
4. False Negative (FN)
A false negative is known as the type-2 error. It is when the actual value is positive and the predicted value is negative. For example, the actual value of a patient is 1 and the predicted value is 0.
Conclusion
The benefit of the confusion matrix is that it gives a summary of the outcomes of the model. For example:
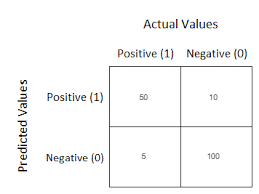
This tells us that:
- 50 people truly have cancer, and it was predicted correctly.
- 10 people have cancer, but the predicted value was wrong.
- 5 people do not have cancer, and the predicted value was wrong.
- 100 people do not have cancer, and it was predicted correctly.
With that, you should now understand what a confusion matrix is…hopefully it didn’t confuse you.