What are four underrated pandas functions?
1) pandas.pivot_table
-
Using this function, we can make a pivot table as a dataframe.
-
Format :
pandas.pivot_table(data, values=None, index=None, columns=None, aggfunc='mean', fill_value=None, margins=False, dropna=True, margins_name='All', observed=False)
- Arguments :
-
data : It consists of a dataframe.
-
values :It is the column that we need to aggregate. This is optional to use.
-
index: Enables us to group the values in a row form.
-
columns: Enables us to group the values in a column form.
-
aggfunc: We can pass a list of functions with which we can aggregate the values of the dataframe. If we use the sum function, we can aggregate values by sum.
-
fill_value: We can use this to replace missing values.
-
margins: We use this to add all the rows and columns.
-
dropna: In this, we should not include any columns whose entries are all NaN.
-
margins_name: It contains the name of the row or the column that will contain the total.
-
observed: It is used when the groups are categorical.
import pandas as pdimport numpy as npdf = pd.DataFrame({"A": ["Hey", "Hey", "there", "Hey", "there"],"B": ["egg", "sandwich", "egg", "sandwich", "egg"],"C": [1, 2, 2, 3, 3]})table = pd.pivot_table(df, values='C', index=['A'],columns=['B'],fill_value=0)print(table)
2) pandas.DataFrame.describe
-
using this function we can find some statistical data about the dataset such as count, mean, frequency, etc.
-
The type of statistical data that will show is different for objects and numerical data.
-
Format :
pandas.DataFrame.describe(percentiles=None, include=None, exclude=None, datetime_is_numeric=False)
- Arguments :
-
percentiles: A list of numbers that allows us to decide the marks of only the 75th percentile of students.
-
include: With this, we can choose what data types to include.
-
exclude: With this, we can choose what data types we want to exclude.
-
datetime_is_numeric: This will decide whether or not we will treat DateTime data types as a numeric.
import pandas as pdimport numpy as npdf = pd.DataFrame({"A": ["Hey", "Hey", "there", "Hey", "there"],"B": ["egg", "sandwich", "egg", "sandwich", "egg"],"C": [1, 2, 2, 3, 3]})print(df.describe())#Using df from above code
3) pandas.Series.combine
- We can combine the values of two series using the function below.
- Format :
Series.combine(other, func, fill_value=None)
-
Here, we are combining the series in such a manner that we get a series that has max values
-
Arguments :
-
other: It is the series value that needs to be combined.
-
func: It takes 2 scalars as an input and returns the elements.
-
fill_value: We can use this to replace missing values.
import pandas as pds1 = pd.Series({'MCD': 190.0, 'BK': 240.0})s2 = pd.Series({'MCD': 278.0, 'BK': 200.0, 'duck': 120.0})print(s1.combine(s2, max))
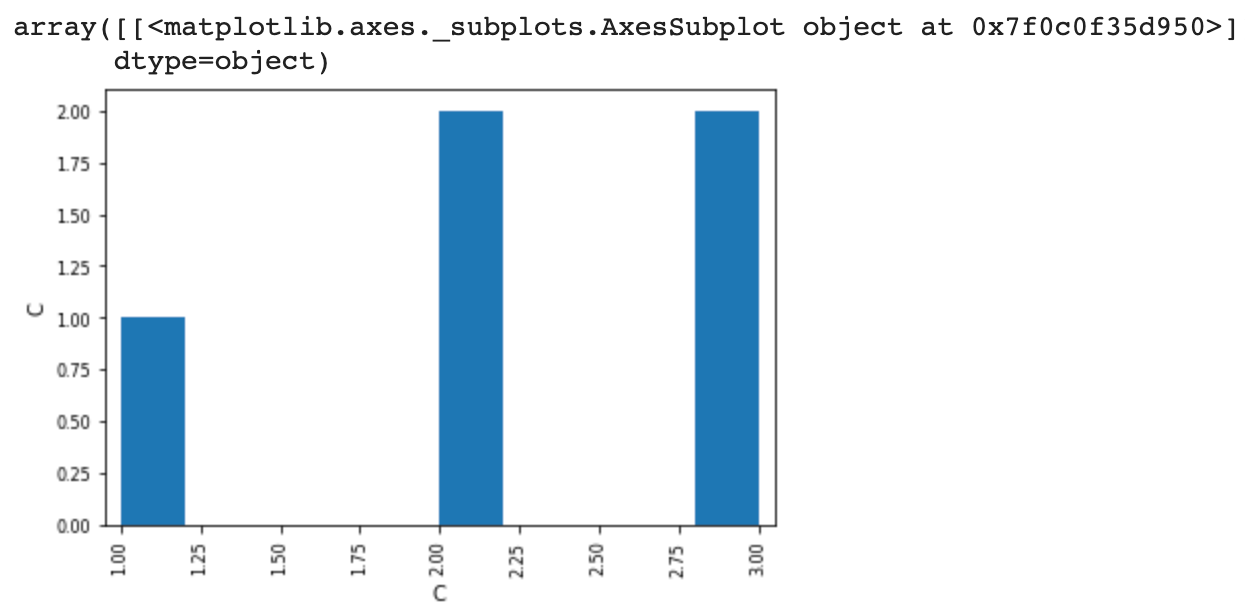
4) pandas.plotting.scatter_matrix
-
It is used to draw a matrix of scatter plots.
-
Format :
pandas.plotting.scatter_matrix(frame, alpha=0.5, figsize=None, ax=None, grid=False, diagonal='hist', marker='.', density_kwds=None, hist_kwds=None, range_padding=0.05, **kwargs)
- Arguments :
-
frame: It stands for DataFrame.
-
alpha: With this, you can decide how much transparency you want to apply. The value should usually be a float.
-
figsize: It takes in two inputs from the user both in float. The input should be given in terms of the tuple, which denotes width and height, respectively (width, height).
-
ax: It is a Matplotlib axis object.
-
grid: It takes a boolean value by default. Its value is false, but by setting this to True, it will show you the grid.
-
diagonal:{‘hist’, ‘kde’}: Type ‘kde’ for Kernel Density Estimation and ‘hist’ for Histogram plot.
-
marker: It is Matplotlib marker type.
-
density_kwds: It is passed on to kernel density and used to find the estimated plot.
-
hist_kwds: It is the keyword arguments that are passed on to the hist function.
-
range_padding: It is the relative extension of the axis range. The axis of
xandywith respect to (x_max - x_minory_max - y_min),the default value is given as0.05. -
**kwargs: Keyword arguments need to be passed on to the scatter function.
import pandas as pddf = pd.DataFrame({"A": ["Hey", "Hey", "there", "Hey", "there"],"B": ["egg", "sandwich", "egg", "sandwich", "egg"],"C": [1, 2, 2, 3, 3]})pd.plotting.scatter_matrix(df, alpha=0.2)
RELATED TAGS
CONTRIBUTOR
