AI-powered learning
Save this course
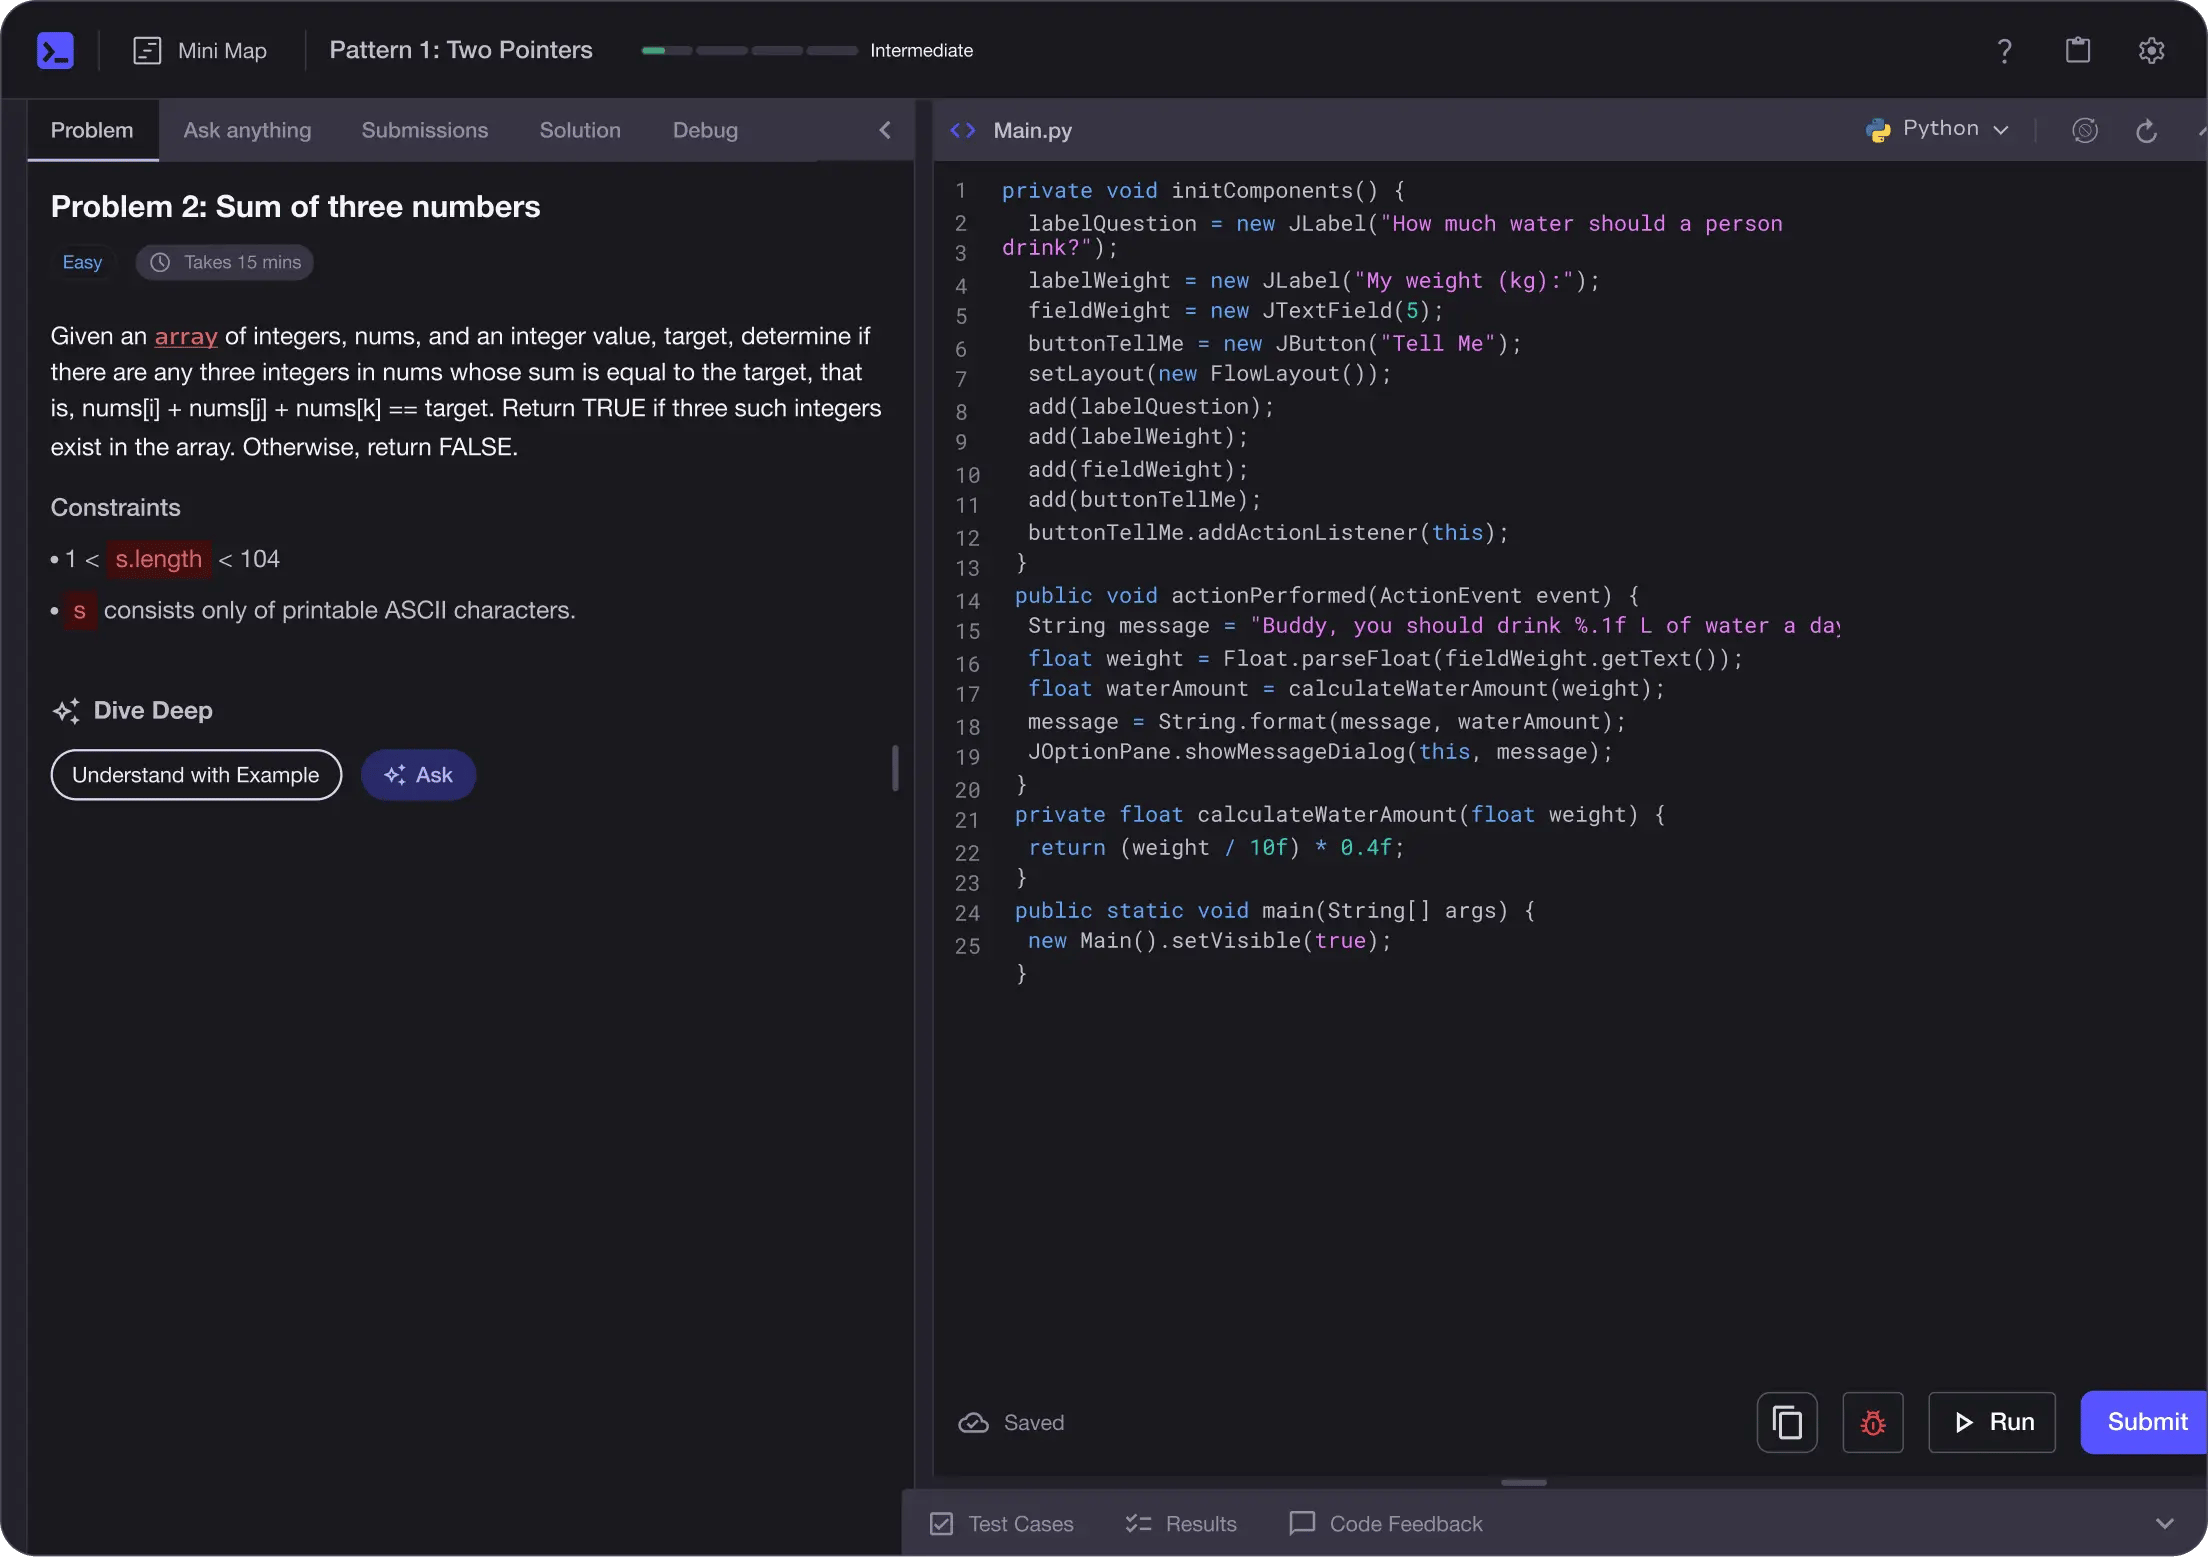
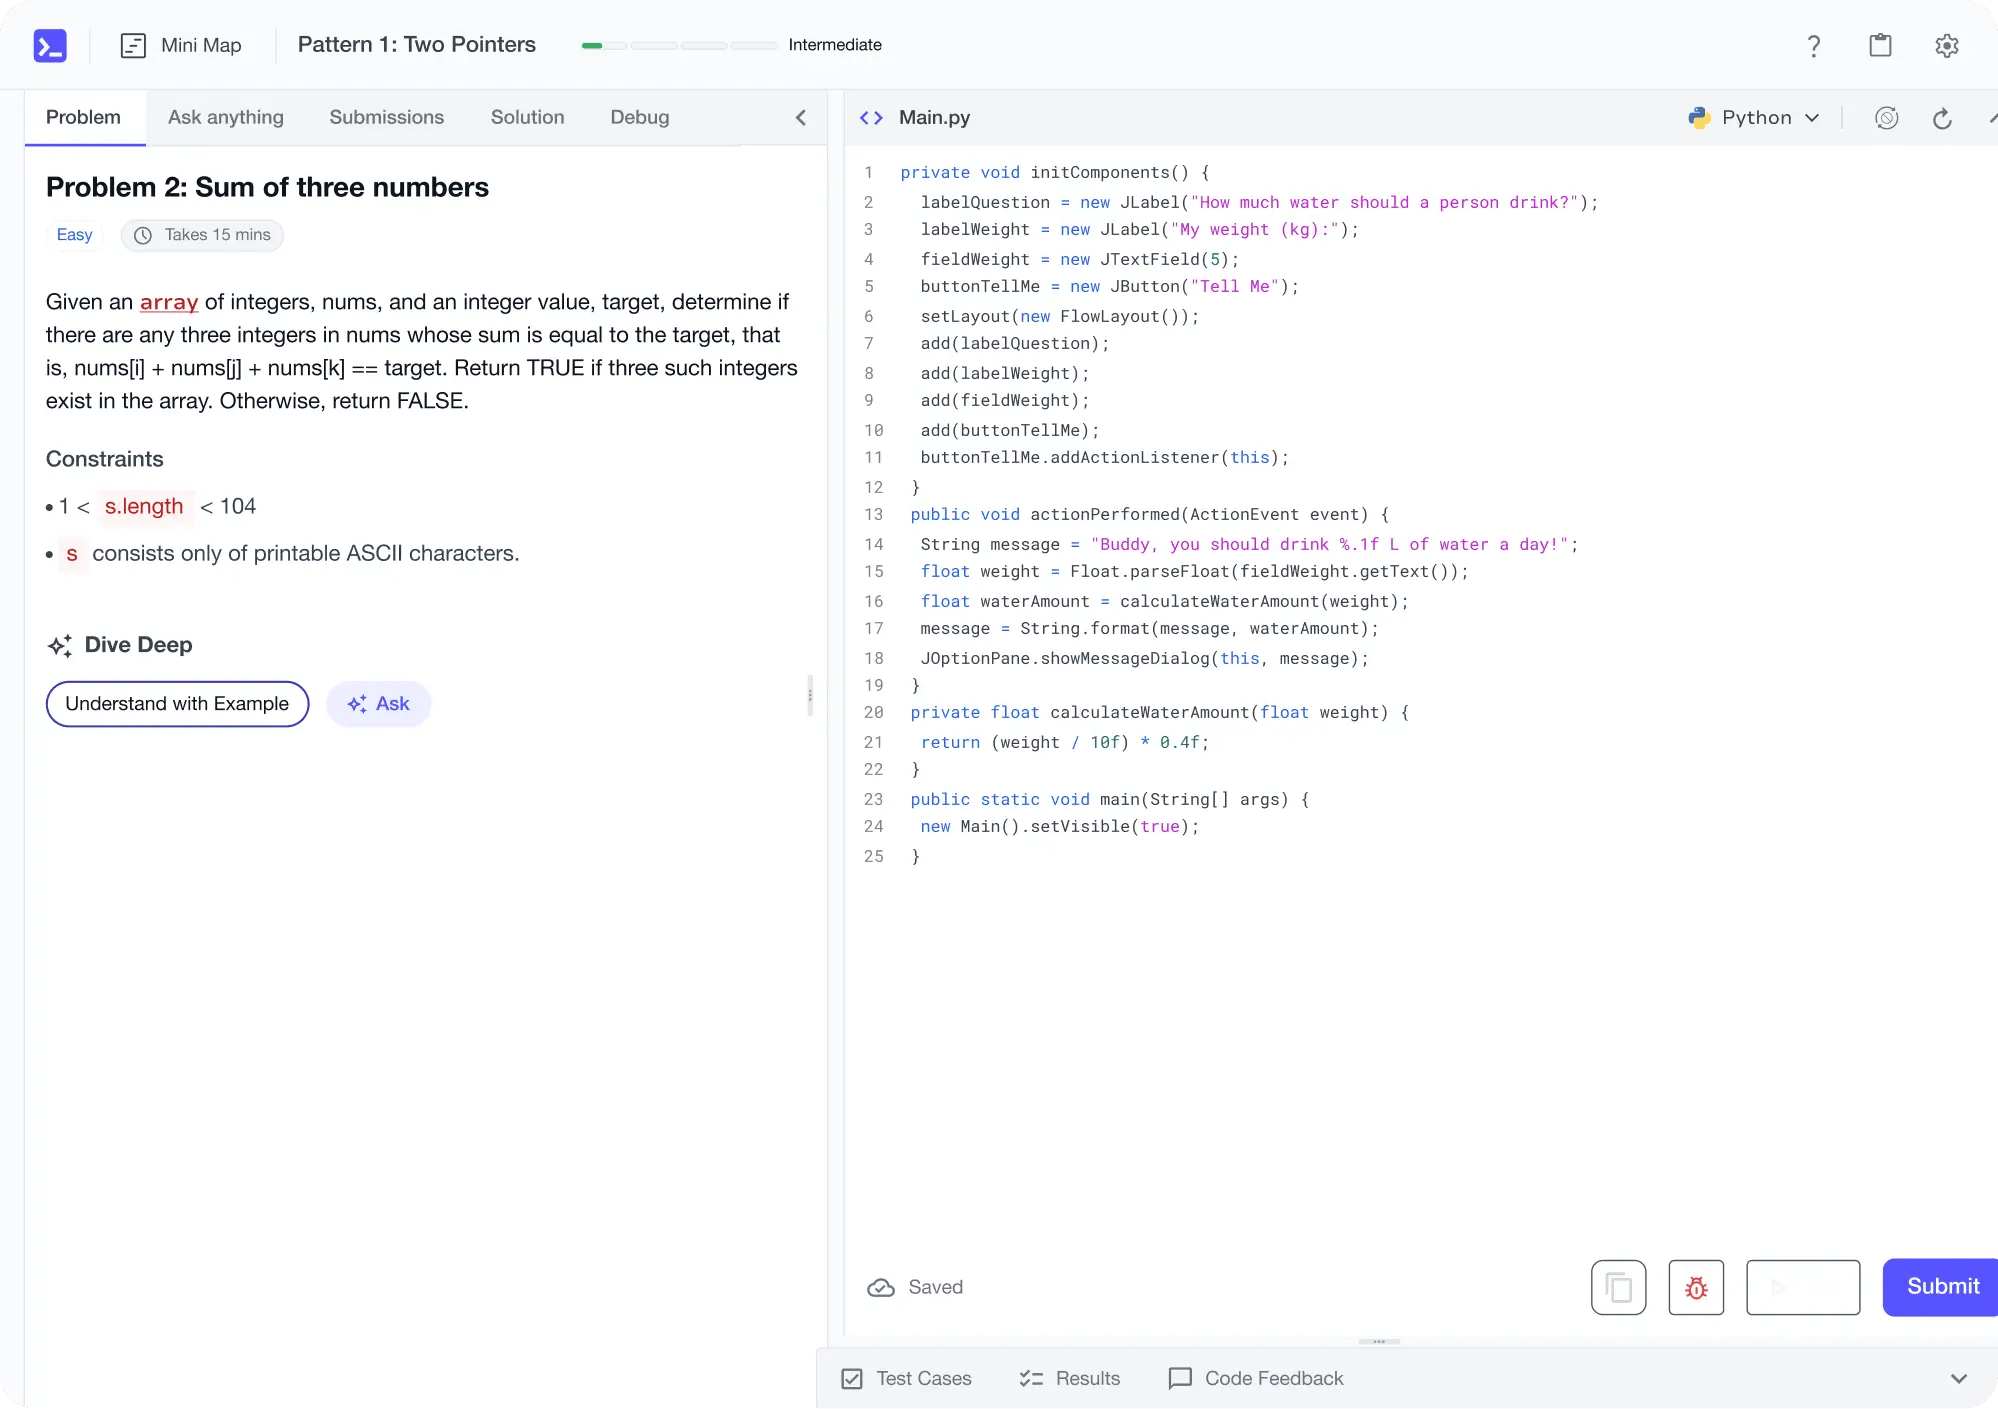
Master D3.js for Data Visualization
Gain insights into creating interactive web data visualizations with D3.js. Learn about SVGs, advanced scatter plots, animations, and interactivity to transform data into meaningful insights.
5.0
95 Lessons
24h
Updated 2 months ago
Join 3 million developers at
Join 3 million developers at
LEARNING OBJECTIVES
- Integrate D3.js into a web project via CDN and configure UTF-8 encoding and builds
- Use D3 selections to append elements and modify attributes, text, classes, and styles
- Bind data with data(), enter/update/exit, and join() to add, update, and remove elements
- Load and parse external CSV/JSON data with D3 fetch functions and async/await
- Build scatter plots with SVG containers, margins, scales, axes, and tick/label refinements
- Create heatmaps using grid layouts and color scales (linear, quantize, quantile, threshold)
- Implement interactive charts with events, tooltips, transitions, and Voronoi/Delaunay hover
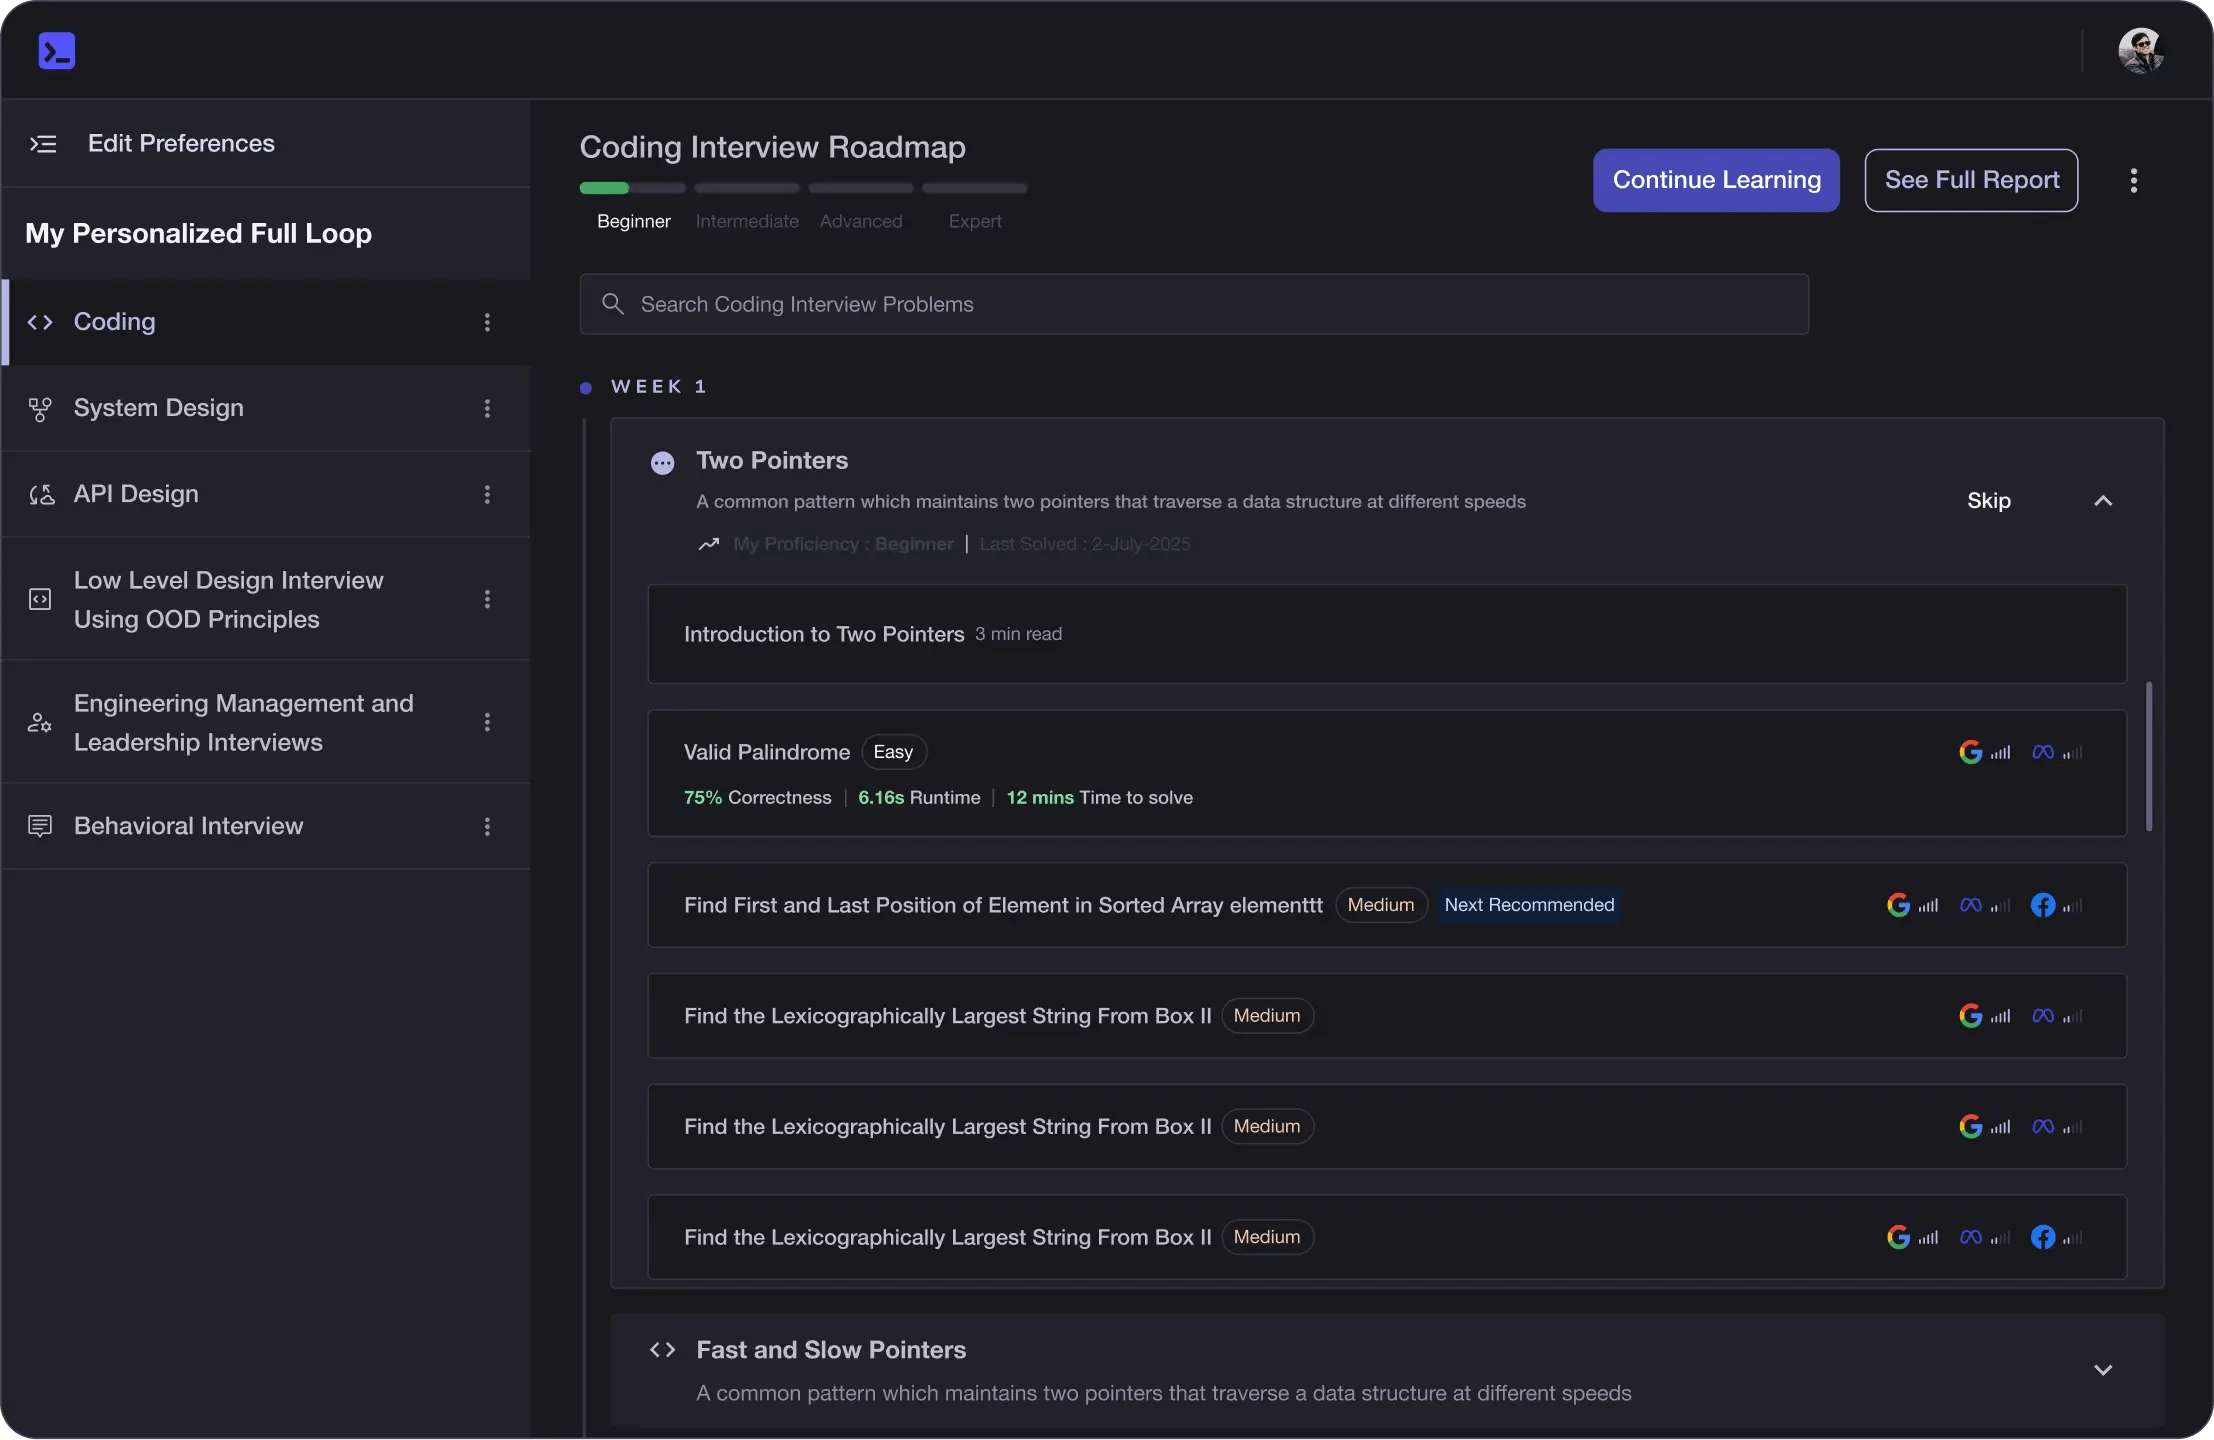
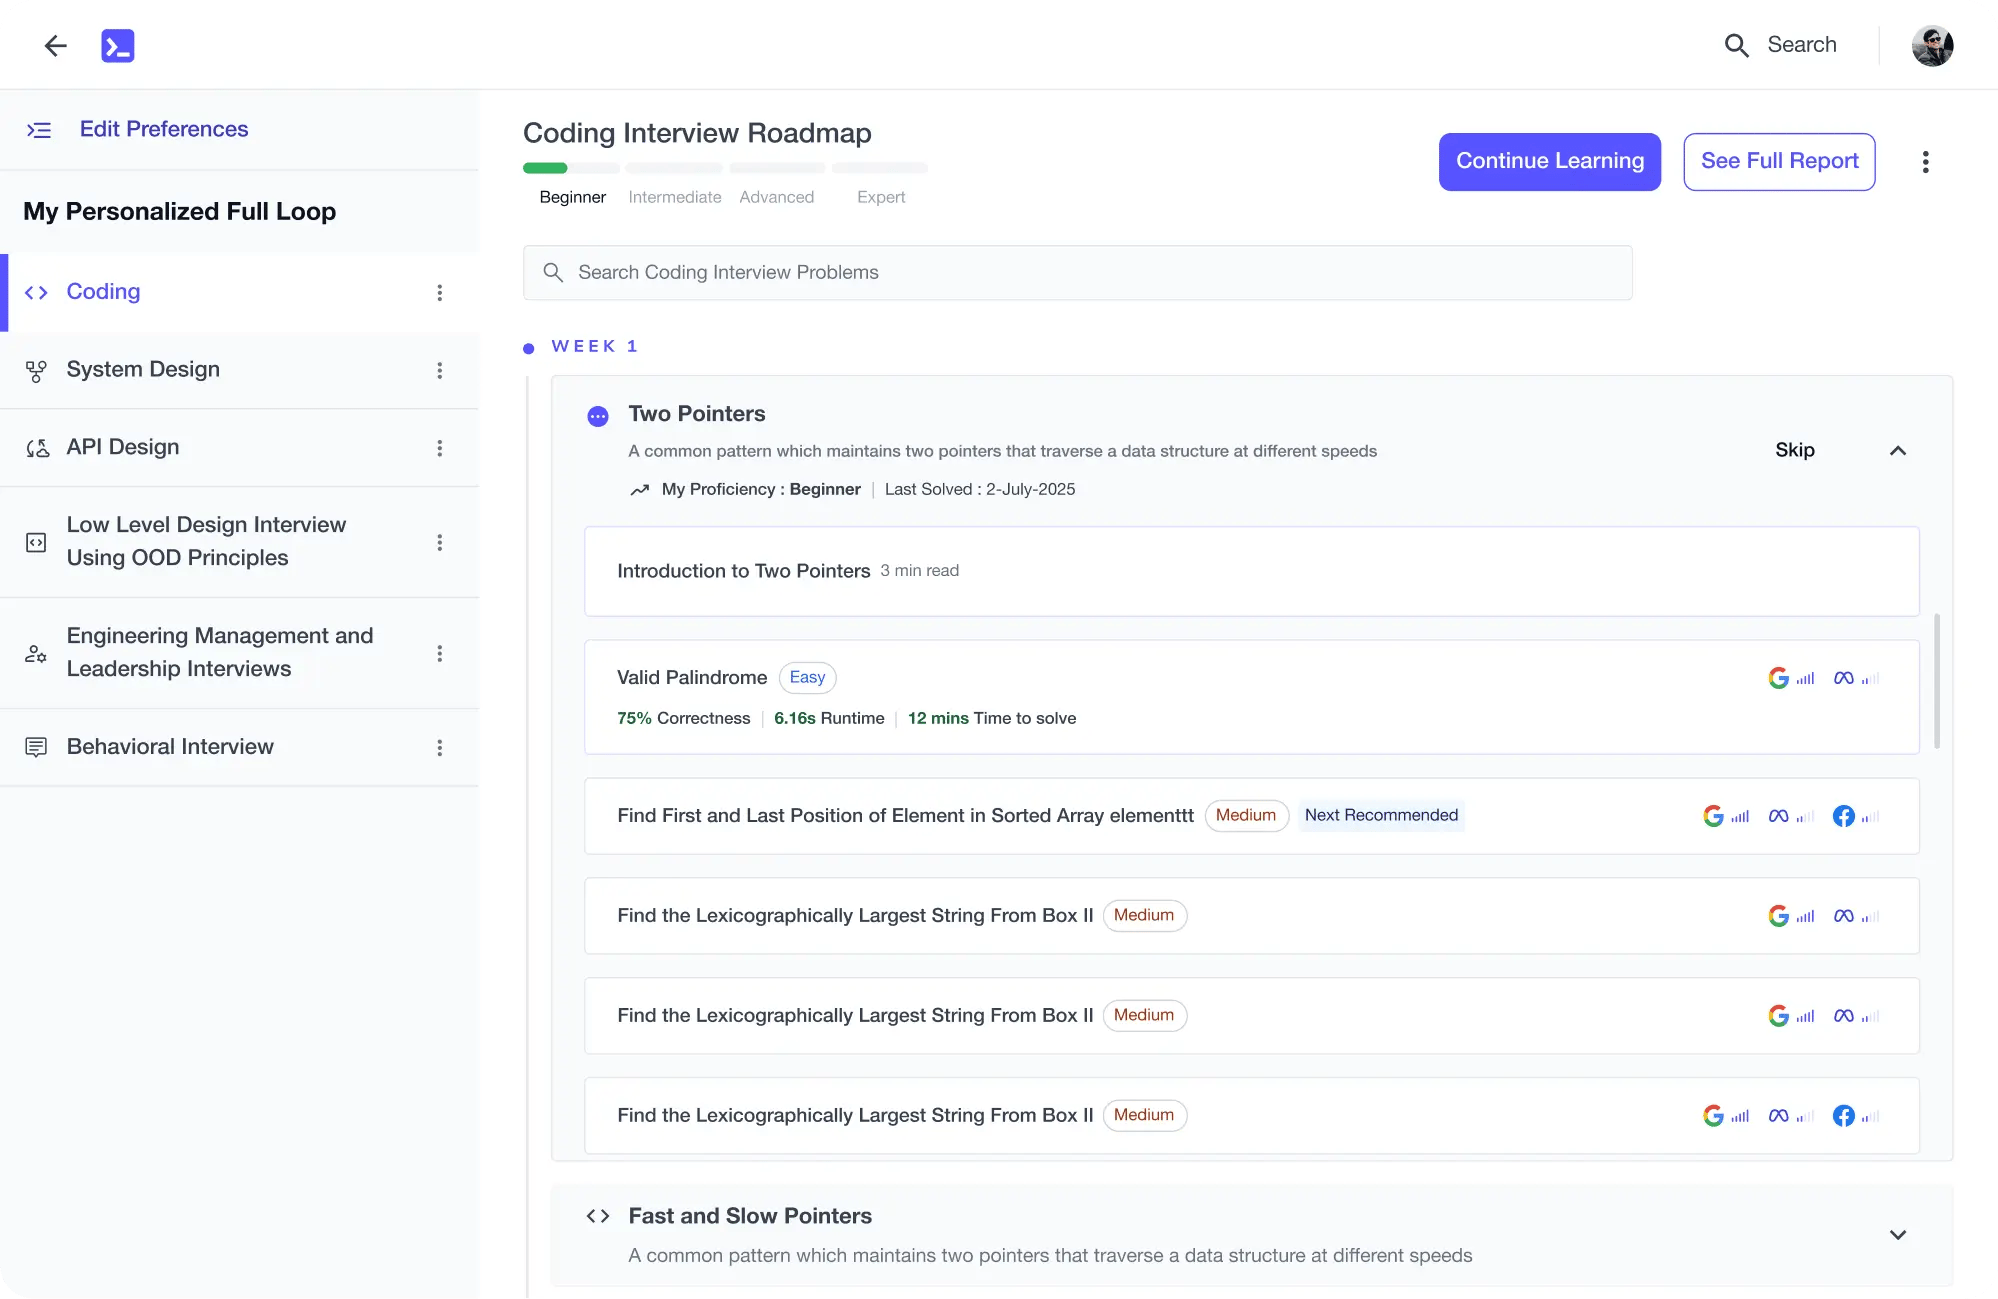
Learning Roadmap
1.
Overview
Overview
Get familiar with D3.js essentials and mastering web-based data visualizations.
2.
SVG Basics
SVG Basics
Look at SVG for scalable, high-quality visualizations using D3.js.
3.
D3 Fundamentals
D3 Fundamentals
13 Lessons
13 Lessons
Examine D3.js fundamentals covering initialization, selection, data joining, transformation methods, and handling data externally.
4.
Drawing a Scatter Plot
Drawing a Scatter Plot
15 Lessons
15 Lessons
Grasp the fundamentals of drawing scatter plots with D3.js, including scales and axes.
5.
Scales
Scales
14 Lessons
14 Lessons
Take a closer look at understanding and utilizing various data scales in D3.js.
6.
Animations & Interactivity
Animations & Interactivity
21 Lessons
21 Lessons
Tackle animations, interactivity, and dynamic updates in D3.js for effective data visualization.
7.
Even More Charts!
Even More Charts!
23 Lessons
23 Lessons
Master the creation of diverse D3.js charts, including line, pie, and stacked bar charts.
8.
Conclusion
Conclusion
3 Lessons
3 Lessons
Learn how to use D3.js for diverse visualizations and efficient editor setup.
Certificate of Completion
Showcase your accomplishment by sharing your certificate of completion.
Complete more lessons to unlock your certificate
Developed by MAANG Engineers
ABOUT THIS COURSE
In this course, you will learn to create your own interactive data visualizations for the web with D3.js, a very popular JavaScript library.
Starting with the fundamentals, you'll learn about SVG, selections, classes, and styles, as well as displaying data. This will give you the base to start working with more advanced concepts.
Once you’ve got the basics out of the way, you will start practicing drawing various scatter plots, where you’ll learn all the best practices for creating stunning visualizations.
Lastly, you will dive into scales and one of the more fun parts: adding animation and interactivity.
By the time you finish this course, you will have a powerful new library to add to your resume, and you’ll be able to transform data into meaningful insights.
ABOUT THE AUTHOR
Luis Ramirez Jr
Freelance Software Engineer Instructor. Primarily focused on teaching full-stack JavaScript applications.
Trusted by 3 million developers working at companies
A
Anthony Walker
@_webarchitect_
E
Evan Dunbar
ML Engineer
S
Software Developer
Carlos Matias La Borde
S
Souvik Kundu
Front-end Developer
V
Vinay Krishnaiah
Software Developer
Built for 10x Developers
No Passive Learning
Learn by building with project-based lessons and in-browser code editor
Personalized Roadmaps
The platform adapts to your strengths & skills gaps as you go
Future-proof Your Career
Get hands-on with in-demand skills
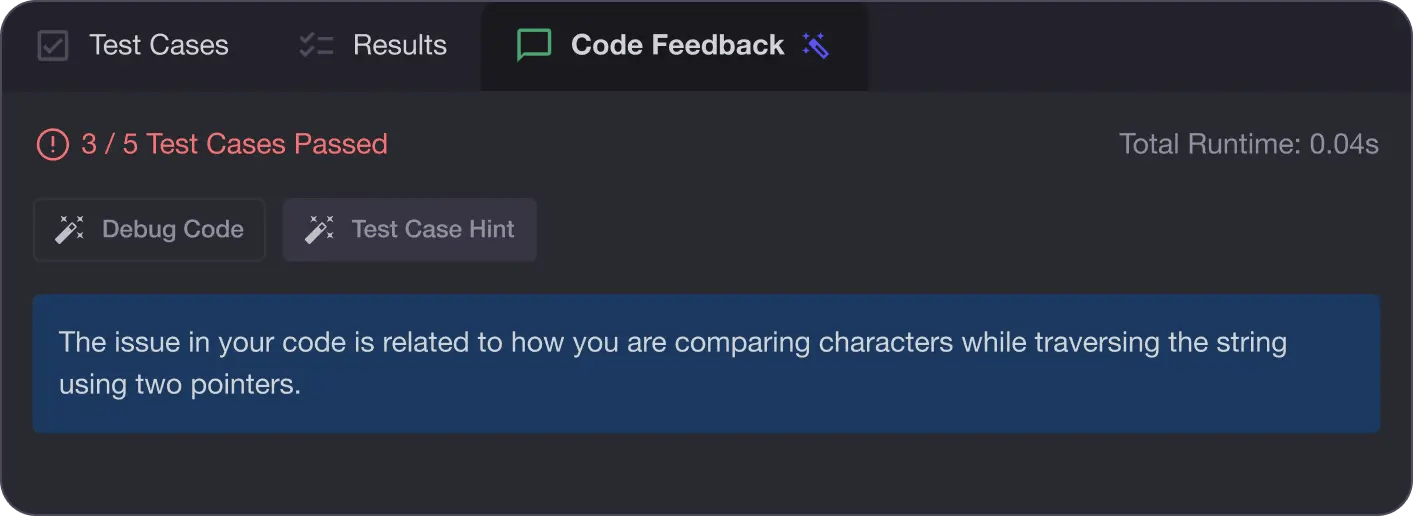
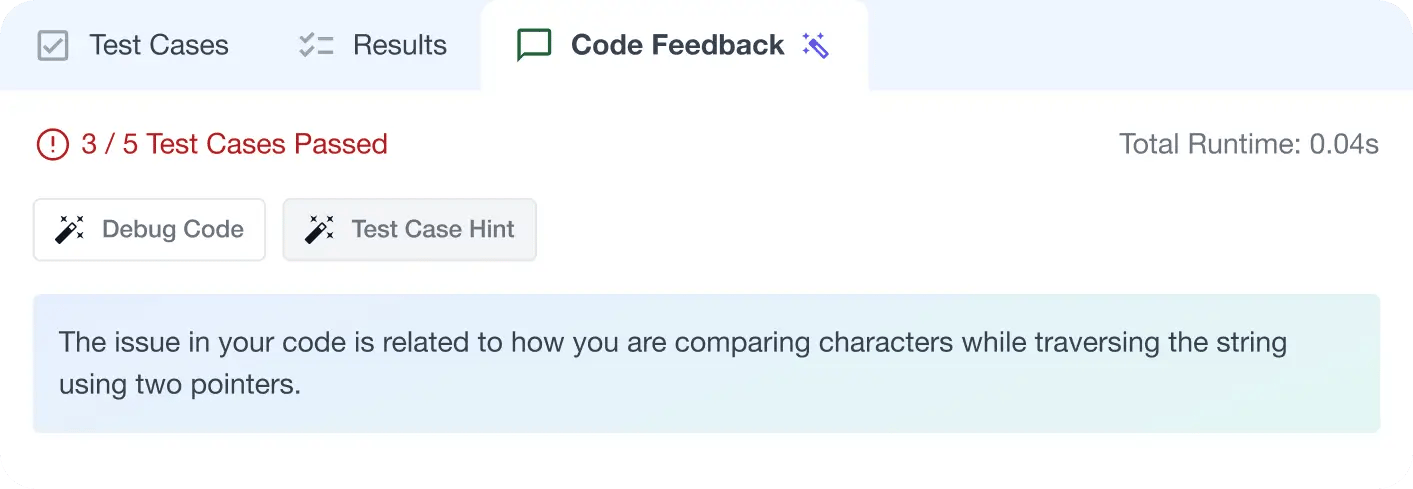
AI Code Mentor
Write better code with AI feedback, smart debugging, and "Ask AI"
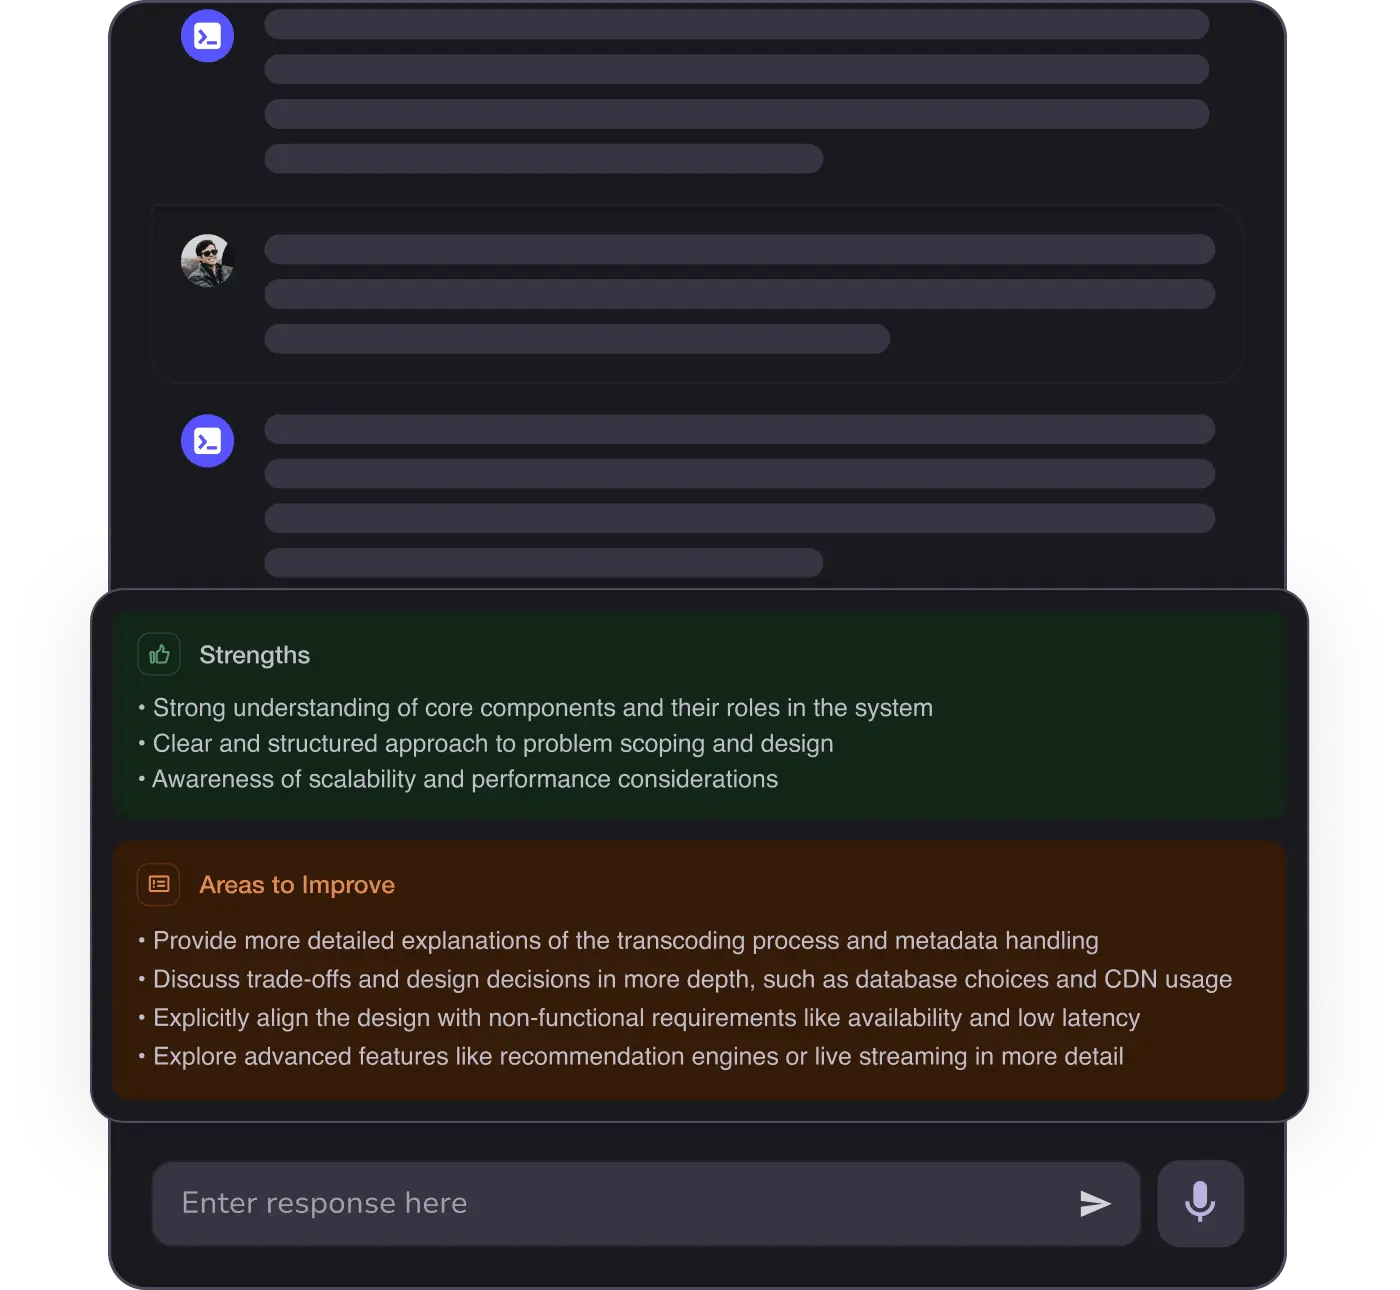
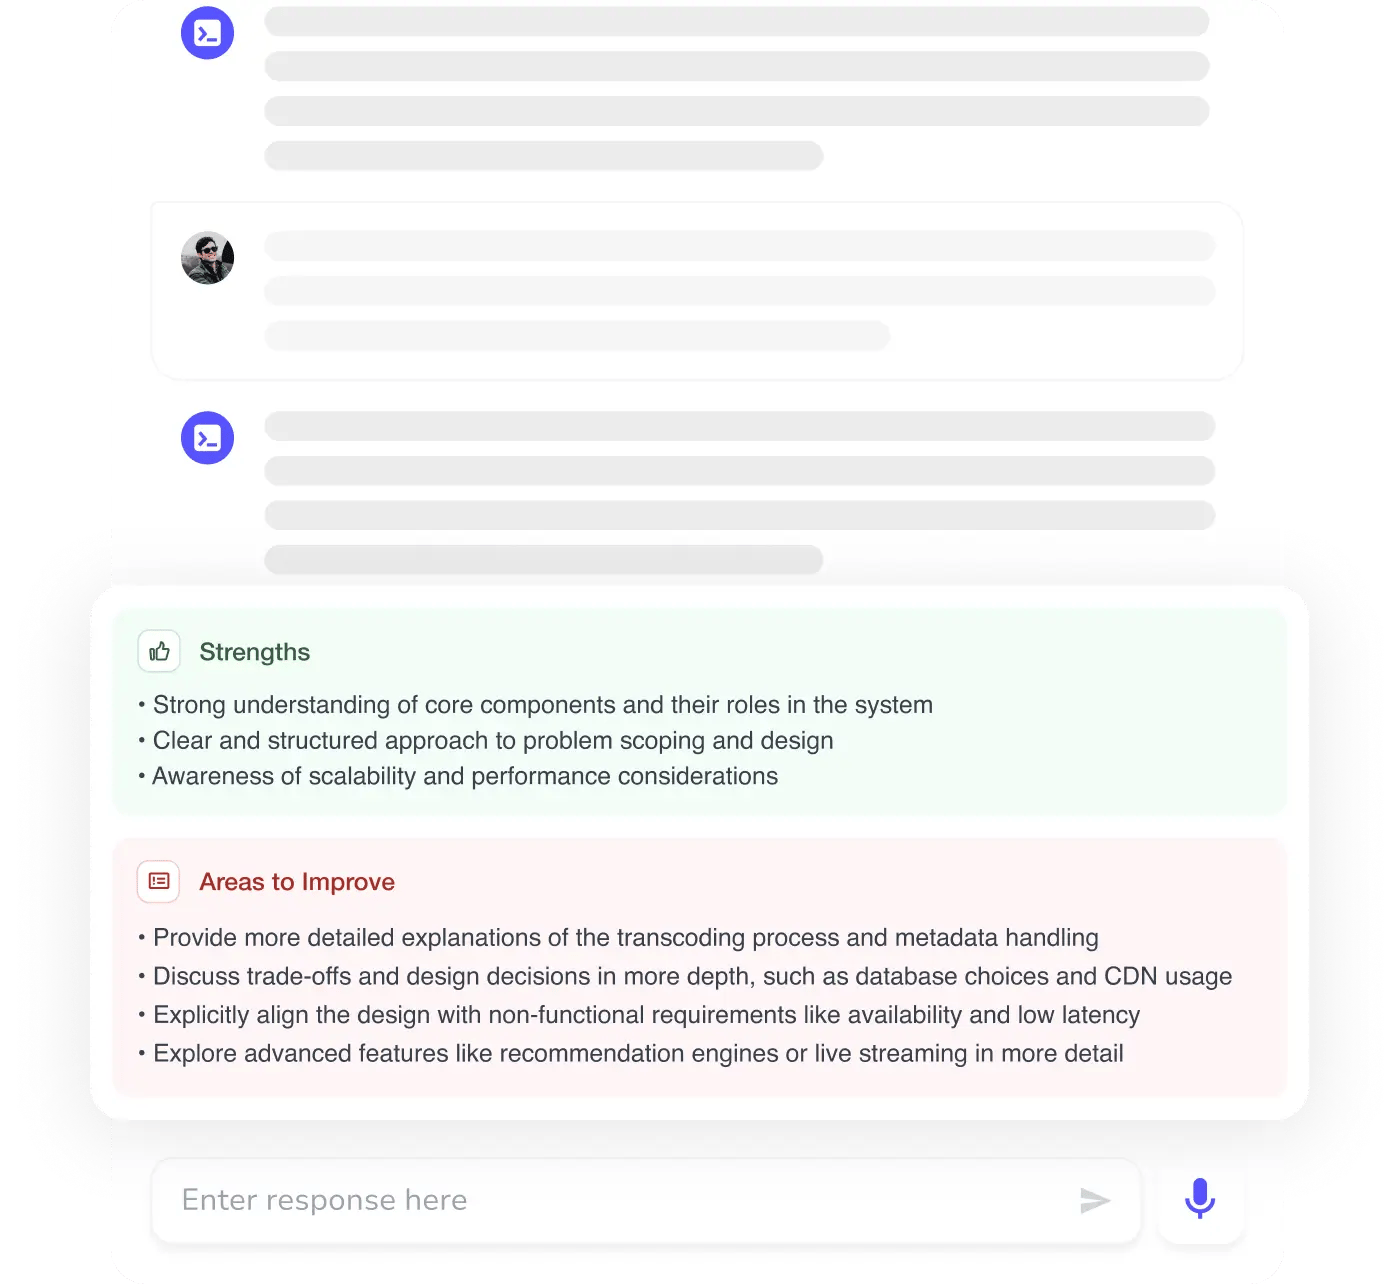
MAANG+ Interview Prep
AI Mock Interviews simulate every technical loop at top companies
Free Resources
