AI-powered learning
Save this course
Interactive Dashboards and Data Apps with Plotly and Dash
Gain insights into creating interactive dashboards and data apps with Plotly Dash. Learn to build, customize, and deploy data-driven applications with various controls and charts effectively.
4.5
102 Lessons
2 Projects
27h
Join 3 million developers at
Join 3 million developers at
LEARNING OBJECTIVES
- An understanding of the Dash ecosystem and how to add interactive functionality to the app using callback functions
- Working knowledge of plotting bar charts, scatterplots, map plots, and histograms using Plotly's Figure object
- Hands-on experience adding interactivity using sliders, drop-down menus, and interactive tables
- Hands-on experience using KMean clustering to test and evaluate a model with machine learning
- The ability to add multiple pages in an app and use URLs as inputs and outputs to interact with different elements in the app
- Hands-on experience deploying an app on a server
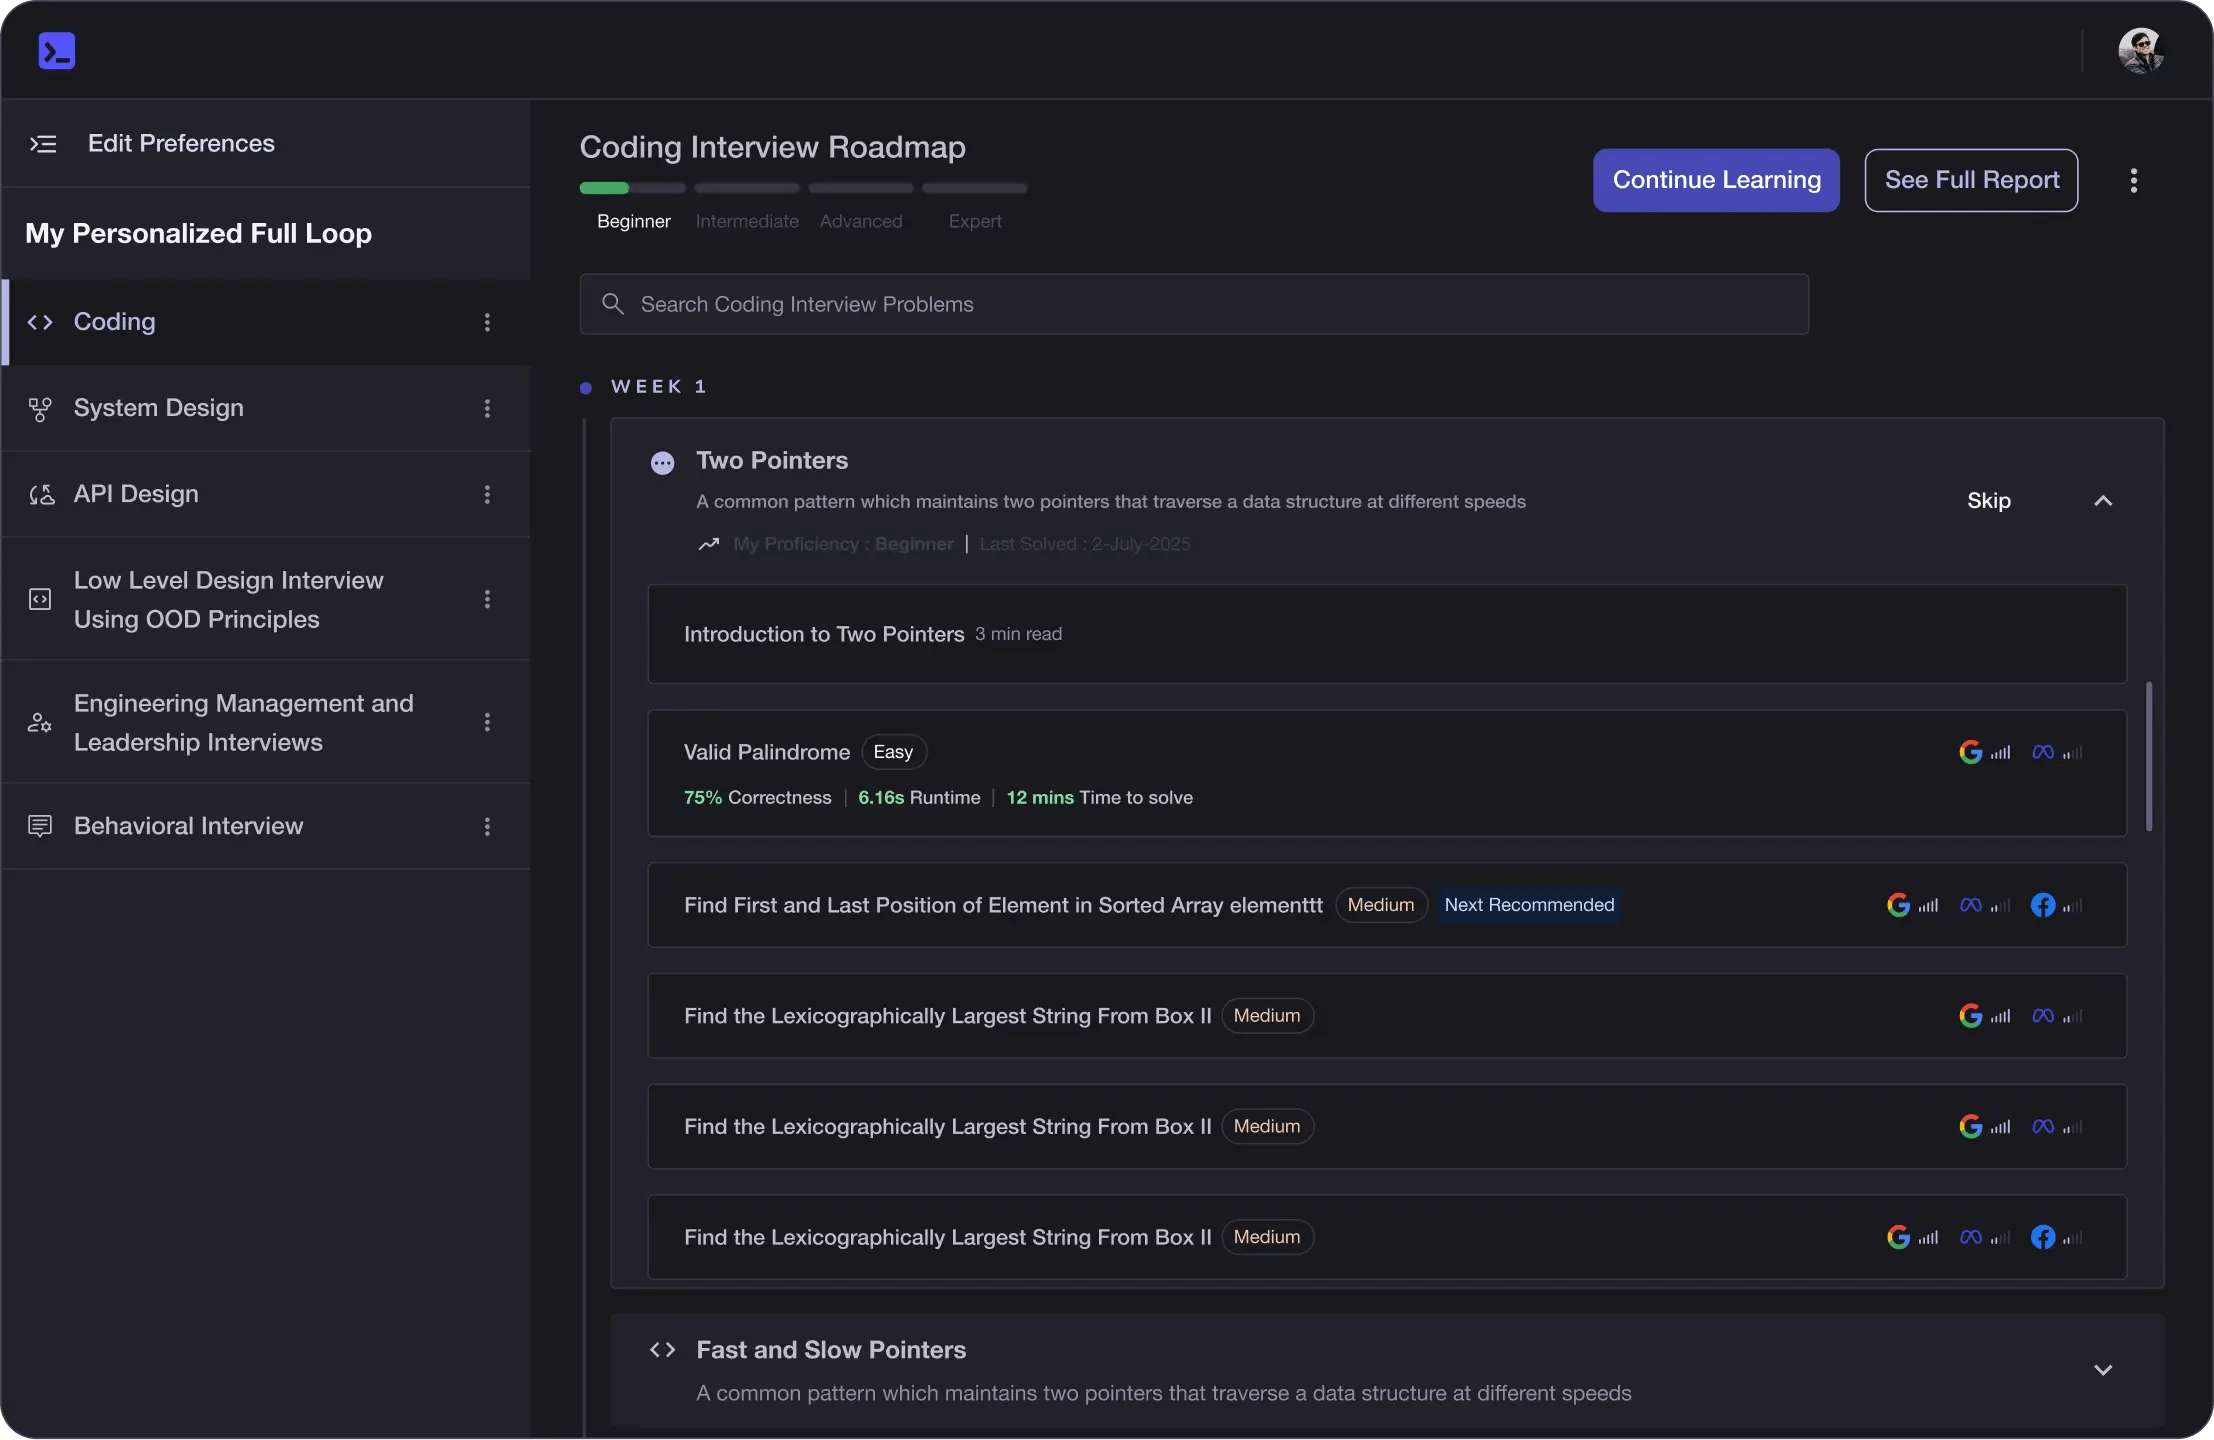
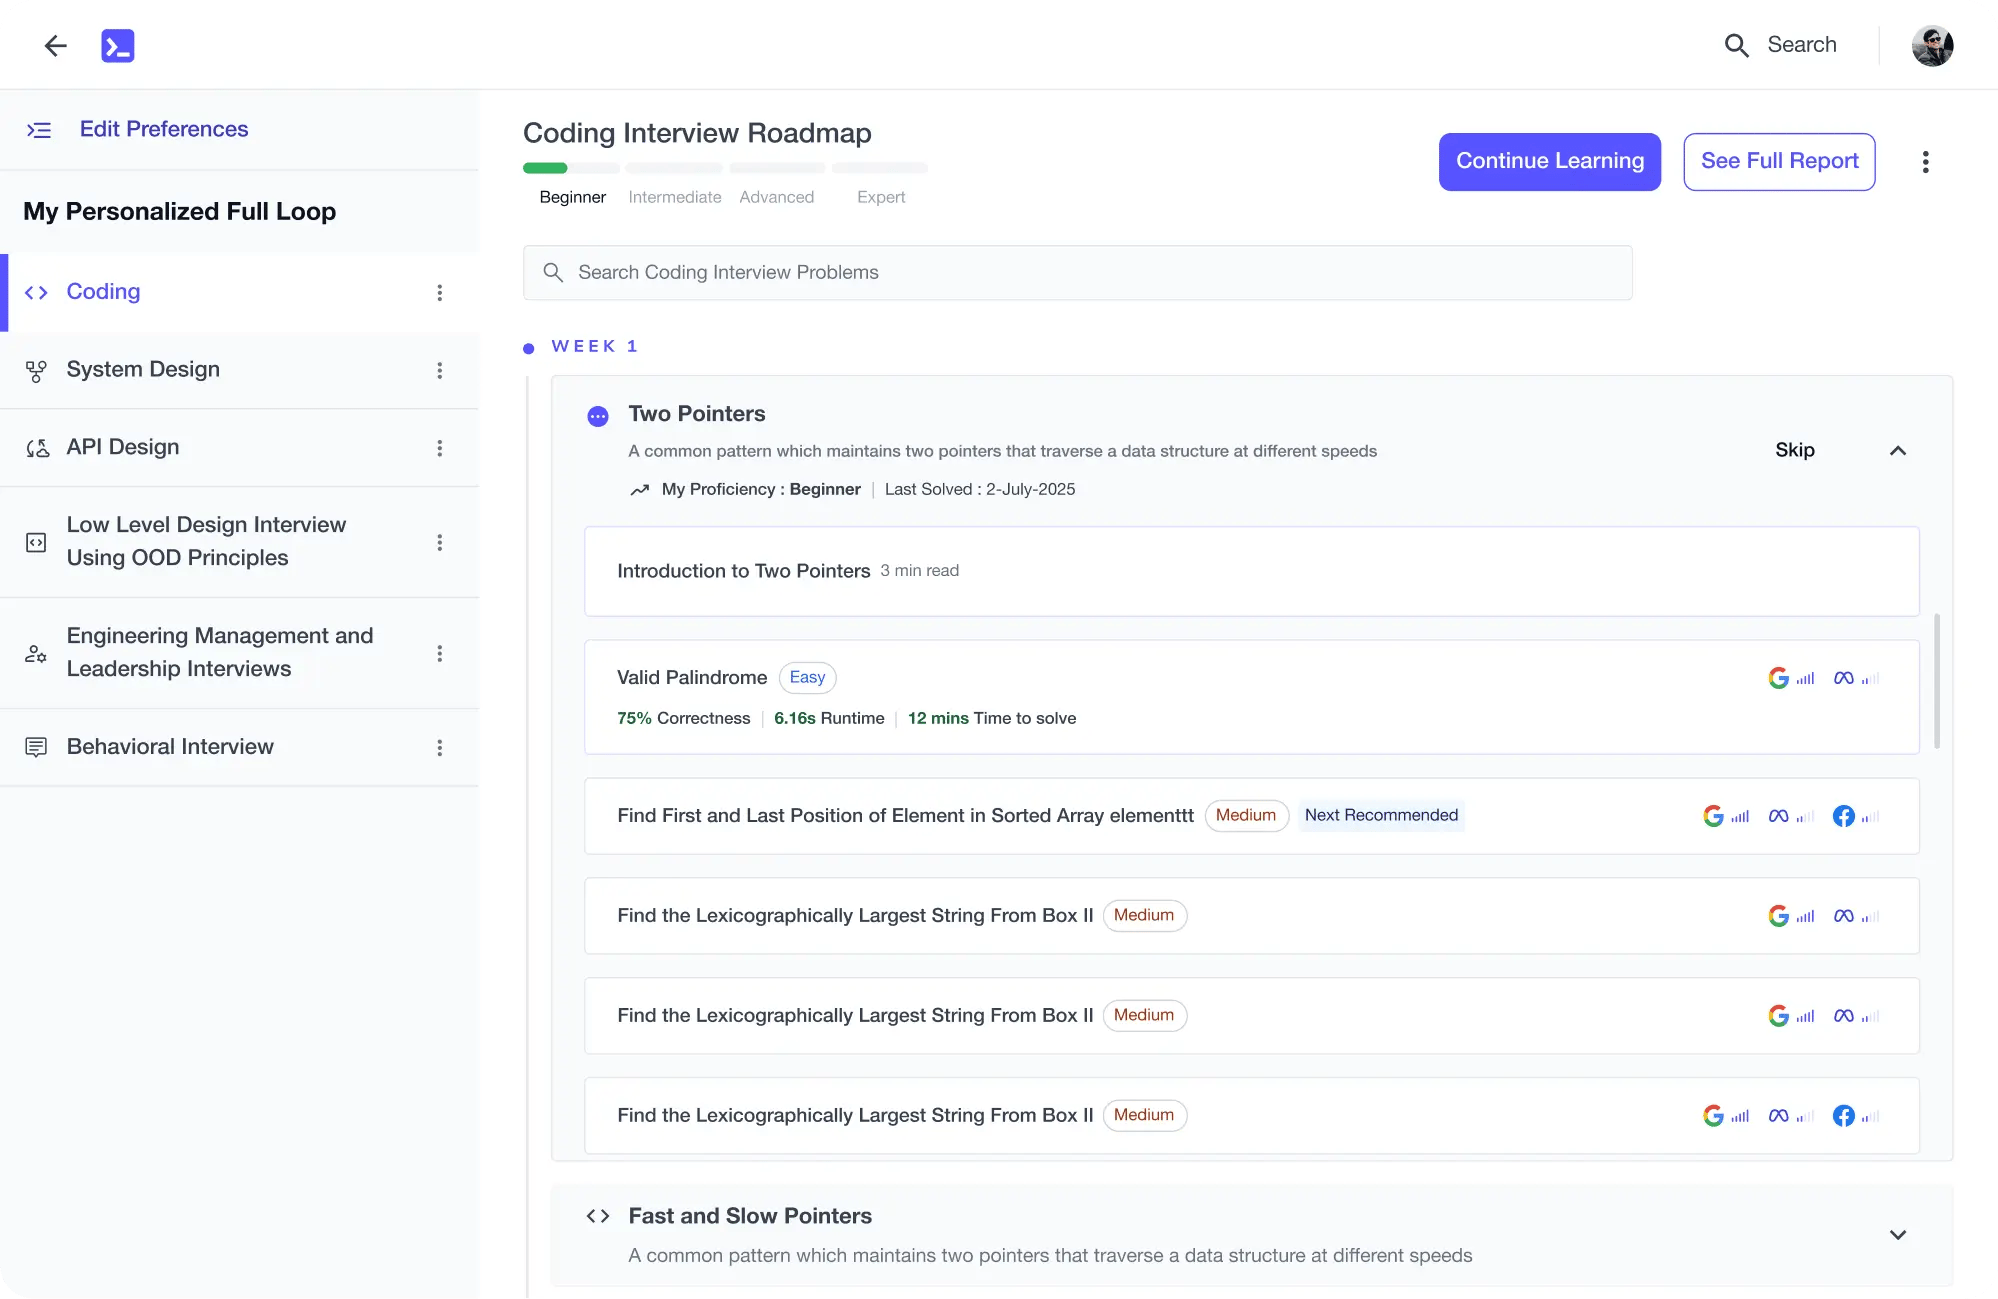
Learning Roadmap
2.
Overview of the Dash Ecosystem
Overview of the Dash Ecosystem
Get started with the essentials of building Dash apps for interactive data visualization.
3.
Exploring the Structure of a Dash App
Exploring the Structure of a Dash App
7 Lessons
7 Lessons
Break apart the core structure of Dash apps using Jupyter for interactivity.
4.
Working with Plotly's Figure Objects
Working with Plotly's Figure Objects
7 Lessons
7 Lessons
Break down complex ideas on creating, modifying, and converting Plotly's Figure objects.
5.
Data Manipulation and Preparation using Plotly Express
Data Manipulation and Preparation using Plotly Express
10 Lessons
10 Lessons
Solve problems in data manipulation, reshaping DataFrames, and creating visualizations using Plotly Express.
6.
Interactively Comparing Values with Bar Charts and Drop-Down Menus
Interactively Comparing Values with Bar Charts and Drop-Down Menus
8 Lessons
8 Lessons
Investigate creating dynamic dashboards with bar charts and drop-down menus for effective data visualization.
7.
Exploring Variables and Filtering Subsets
Exploring Variables and Filtering Subsets
9 Lessons
9 Lessons
Practice using Plotly and Plotly Express for customizable, interactive scatterplots and data filtering.
8.
Exploring Map Plots and Enriching Dashboards with Markdown
Exploring Map Plots and Enriching Dashboards with Markdown
7 Lessons
7 Lessons
Step through creating engaging map plots, implementing Markdown, and using dynamic interactive maps.
9.
Calculating the Frequency of Data with Histograms and Tables
Calculating the Frequency of Data with Histograms and Tables
9 Lessons
9 Lessons
Discover the logic behind visualizing data distributions using histograms and DataTables in Dash.
10.
Letting the Data Speak for Itself with Machine Learning
Letting the Data Speak for Itself with Machine Learning
10 Lessons
10 Lessons
Examine machine learning-driven data clustering, optimization, and interactive app creation with KMeans.
11.
Turbocharge Apps with Advanced Callbacks
Turbocharge Apps with Advanced Callbacks
7 Lessons
7 Lessons
Break down the steps to enhance app interactivity with advanced dynamic callbacks.
12.
URLs and Multipage Apps
URLs and Multipage Apps
7 Lessons
7 Lessons
Take a closer look at creating dynamic multipage applications using URLs and Dash components.
13.
Deploying the App
Deploying the App
8 Lessons
8 Lessons
Follow the process of deploying Dash apps, establishing workflows, managing servers, and scaling with Dash Enterprise.
14.
Next Steps
Next Steps
5 Lessons
5 Lessons
Master the steps to enhancing data skills, optimizing visuals, deploying machine learning, and utilizing Dash Enterprise.
Certificate of Completion
Showcase your accomplishment by sharing your certificate of completion.
Complete more lessons to unlock your certificate
Developed by MAANG Engineers
ABOUT THIS COURSE
Plotly's Dash framework allows Python programmers to develop complete analytic data apps and interactive dashboards.
You'll start with an overview of the Dash ecosystem, its main packages, and the available third-party packages crucial for structuring and building different parts of your apps. Next, you will learn how to create a basic Dash app and add different features to it. You'll then integrate controls in the app—such as drop-downs, checkboxes, sliders, date pickers, and more—and then link them to charts and other outputs. Depending on the data you are visualizing, you will also add several types of charts including scatter plots, line plots, bar charts, histograms, maps, as well as explore the options available for customizing them.
By the end of this course, you’ll have the skills you need to create and deploy an interactive dashboard, be able to handle complexity and code refactoring, and know how to improve your application.
ABOUT THE AUTHOR
Packt
A tech learning platform that provides online courses, eBooks, videos, and other resources to help individuals and organizations stay ahead of emerging and popular technologies.
Trusted by 3 million developers working at companies
A
Anthony Walker
@_webarchitect_
E
Evan Dunbar
ML Engineer
S
Software Developer
Carlos Matias La Borde
S
Souvik Kundu
Front-end Developer
V
Vinay Krishnaiah
Software Developer
Built for 10x Developers
No Passive Learning
Learn by building with project-based lessons and in-browser code editor
Personalized Roadmaps
The platform adapts to your strengths & skills gaps as you go
Future-proof Your Career
Get hands-on with in-demand skills
AI Code Mentor
Write better code with AI feedback, smart debugging, and "Ask AI"
MAANG+ Interview Prep
AI Mock Interviews simulate every technical loop at top companies
Free Resources
