AI-powered learning
Save this course
Introduction to Data Science with Python
Learn core Python programming, work with libraries such as pandas and Matplotlib, and learn data management, analysis, and visualization through practical projects.
4.5
85 Lessons
4h 10min
Updated 2 months ago
Join 3 million developers at
Join 3 million developers at
LEARNING OBJECTIVES
- A deep familiarity with various data functions of Python
- The ability to visualize statistical data using Matplotlib and Plotly libraries
- A working knowledge of the pandas and NumPy libraries for data cleaning and analysis
- A strong proficiency in the basics of data science and the Python programming language
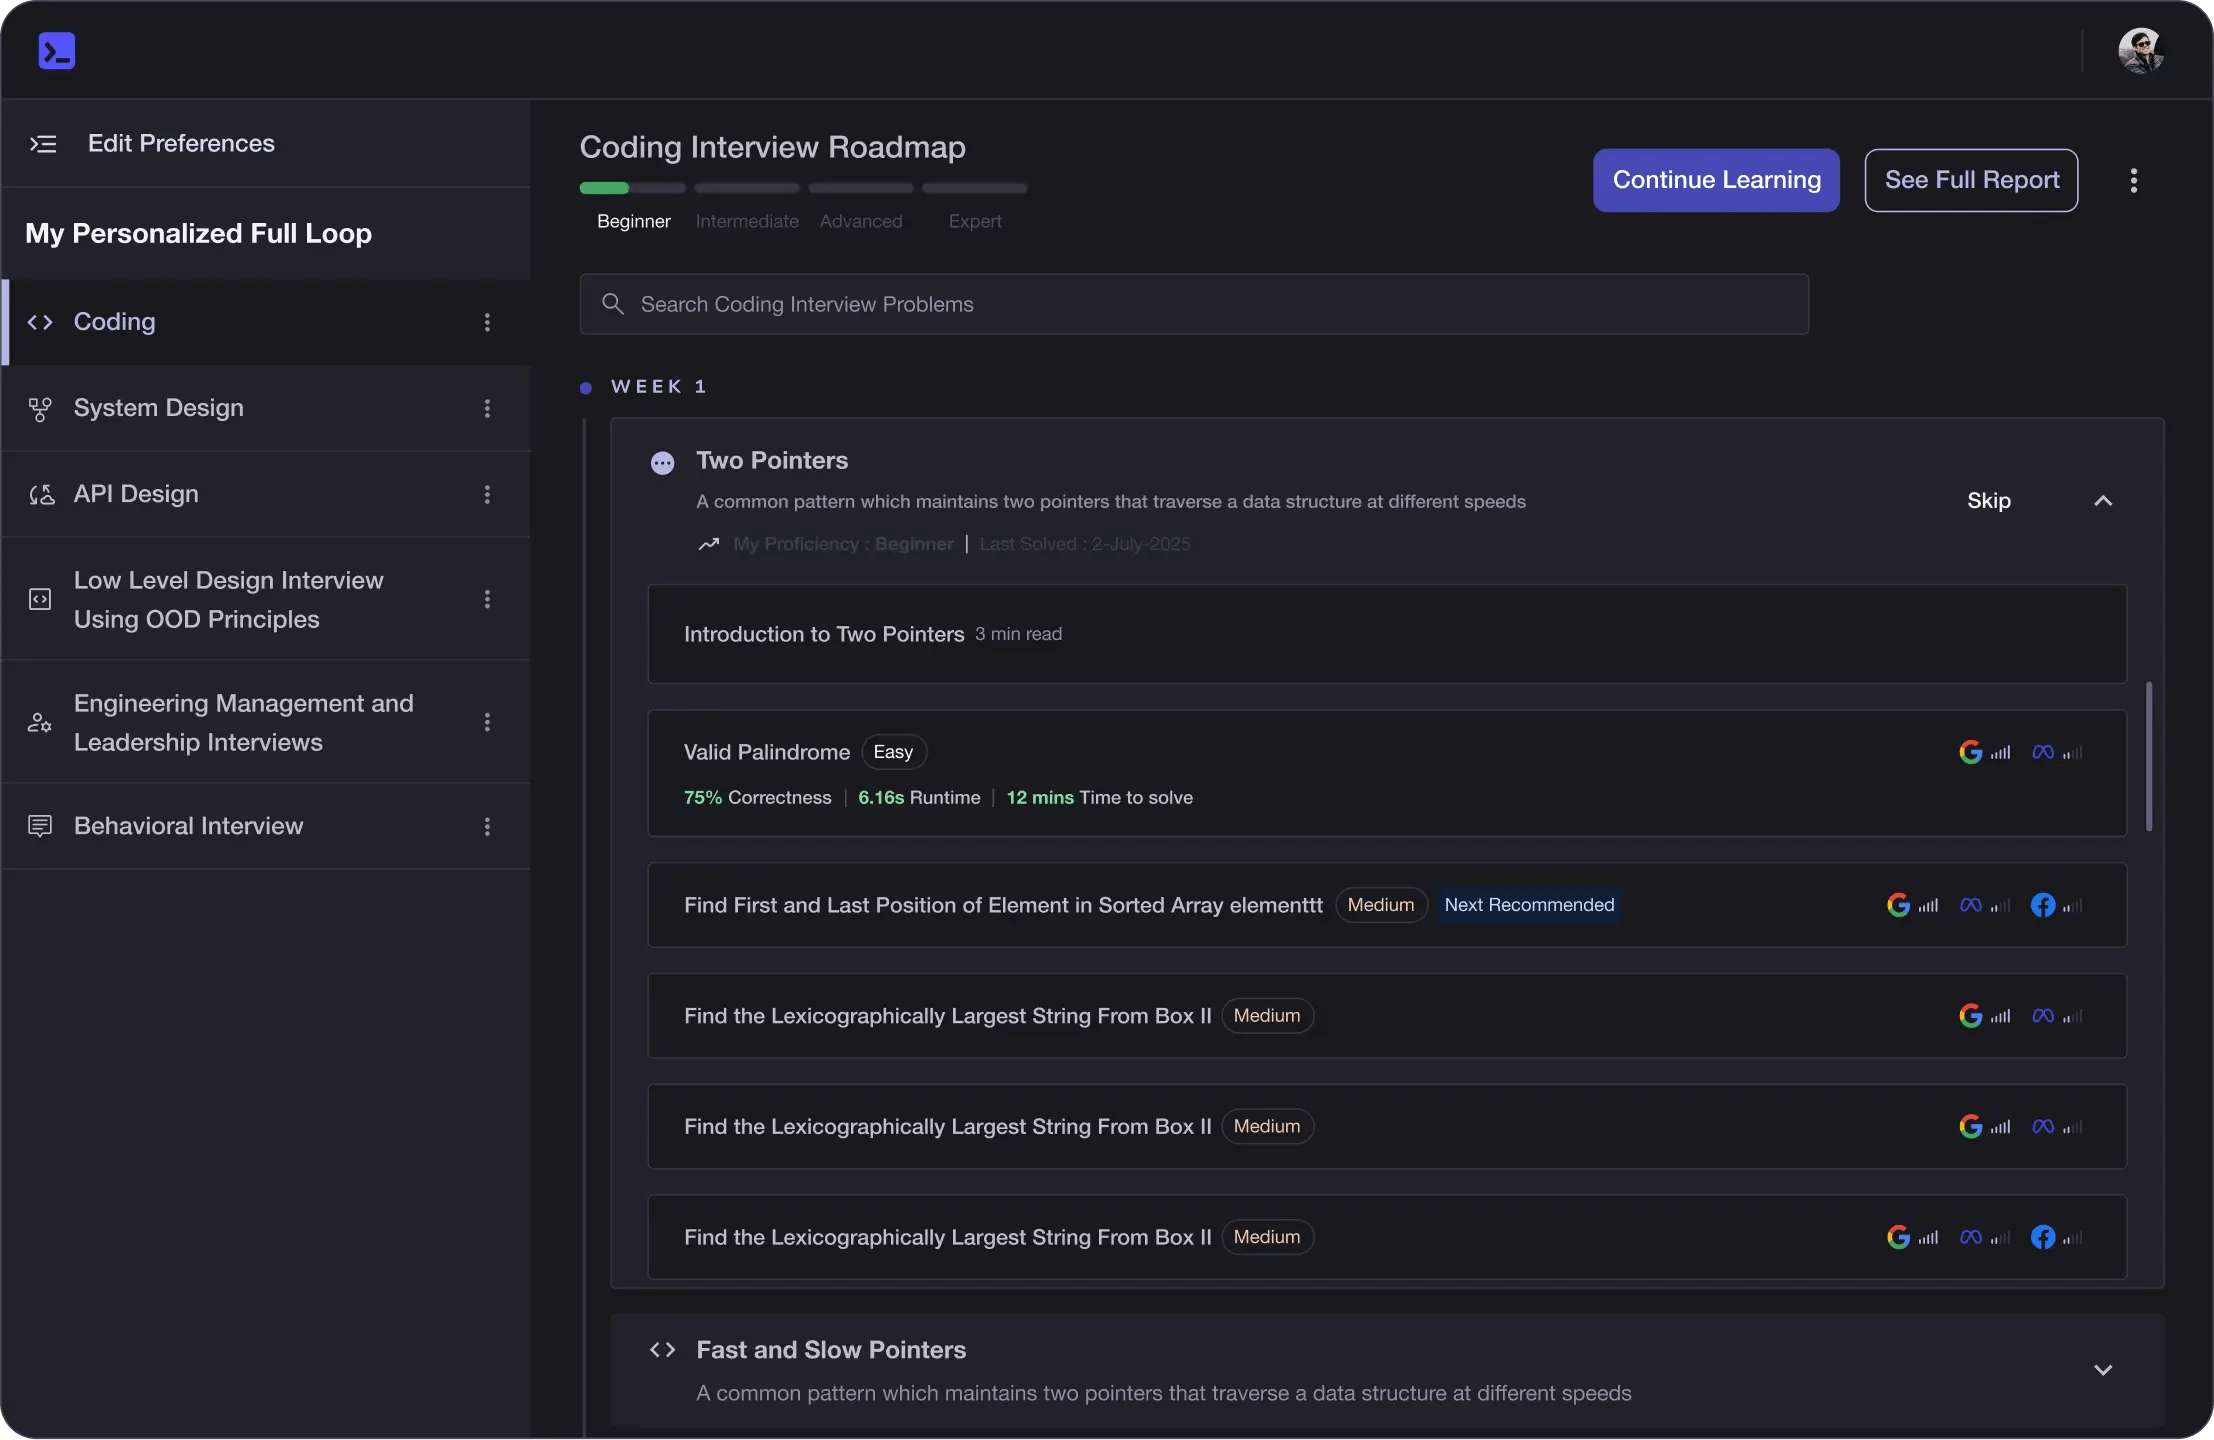
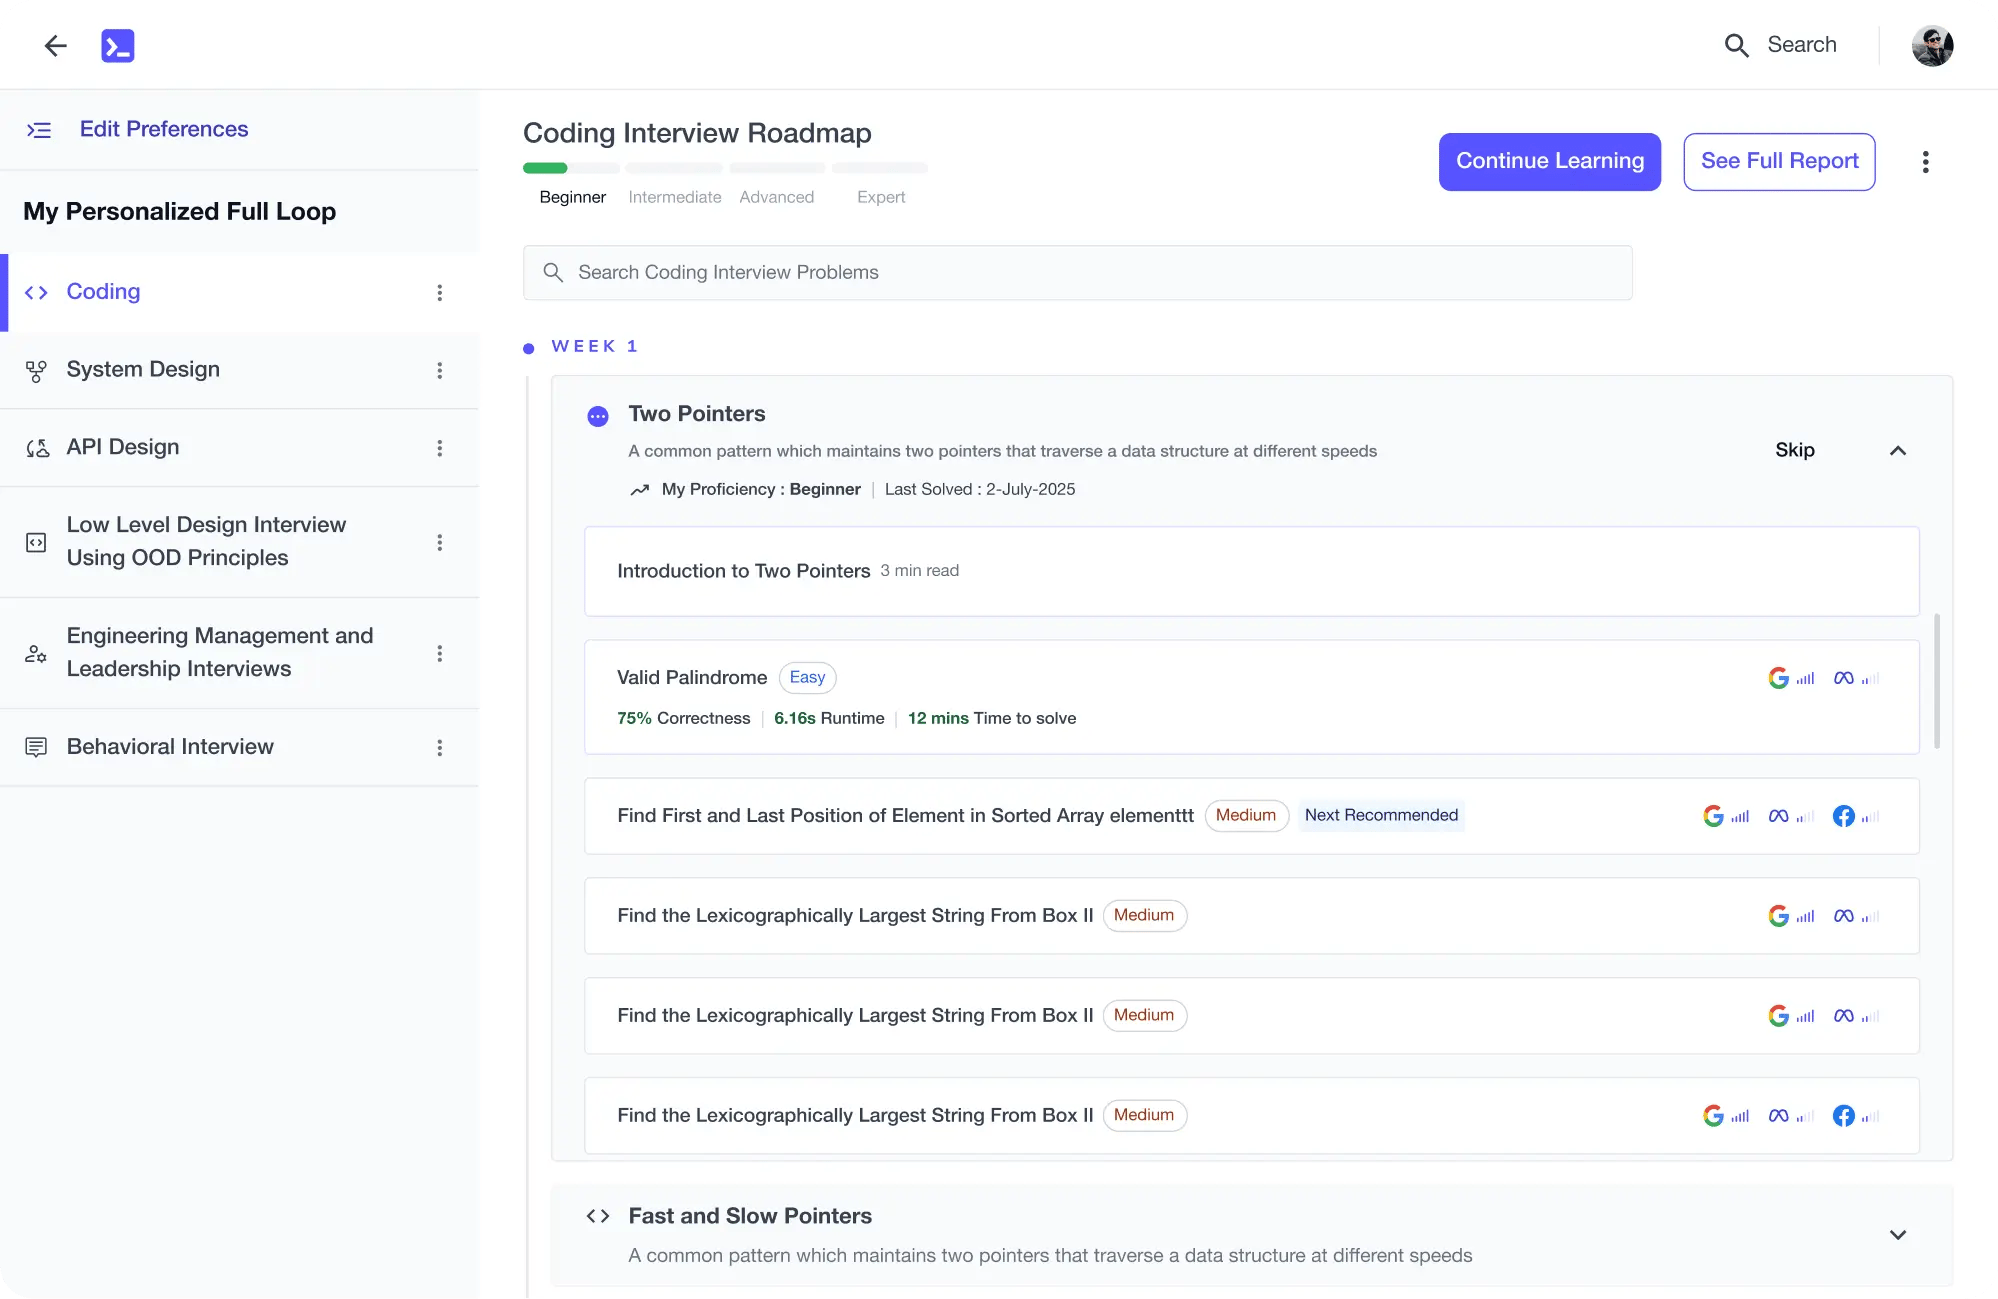
Learning Roadmap
2.
Python Essentials
Python Essentials
Get started with essential Python data types, operators, looping, functions, and challenges.
3.
NumPy: Data Analysis
NumPy: Data Analysis
10 Lessons
10 Lessons
Work your way through NumPy essentials, manipulating arrays, and performing boolean masking and arithmetic operations.
4.
Pandas: Data Analysis
Pandas: Data Analysis
12 Lessons
12 Lessons
Apply your skills to manipulate, clean, merge, and analyze data using pandas efficiently.
5.
Matplotlib: Data Visualization
Matplotlib: Data Visualization
11 Lessons
11 Lessons
Deepen your knowledge of using Matplotlib for creating and customizing data visualizations.
6.
Seaborn: Statistical Data Visualization
Seaborn: Statistical Data Visualization
14 Lessons
14 Lessons
Focus on mastering statistical data visualization using seaborn’s diverse plotting capabilities.
7.
Pandas: Data Visualization
Pandas: Data Visualization
5 Lessons
5 Lessons
Practice using pandas’ robust data visualization tools to create professional, customized plots.
8.
Plotly: Interactive Data Visualization
Plotly: Interactive Data Visualization
3 Lessons
3 Lessons
Try out Plotly for creating interactive visualizations and geographical plotting using maps.
9.
Project 1: Oil vs. Banks During Recession
Project 1: Oil vs. Banks During Recession
7 Lessons
7 Lessons
Get started with analyzing bank and oil stocks using EDA, visualizations, and moving averages.
10.
Project 2: Emergency Calls Dataset
Project 2: Emergency Calls Dataset
7 Lessons
7 Lessons
Work your way through emergency call data analysis with advanced visualization techniques.
Certificate of Completion
Showcase your accomplishment by sharing your certificate of completion.
Complete more lessons to unlock your certificate
Developed by MAANG Engineers
ABOUT THIS COURSE
Python is a widely used programming language for data science and analytics. It is used in industries such as finance, healthcare, and technology. It has a simple syntax, supports multiple programming paradigms, and provides libraries for statistical analysis and data visualization.
This course is a comprehensive introduction to statistical analysis using Python. You’ll start with a step-by-step guide to the fundamentals of programming in Python. You’ll learn to apply these functions to numerical data. You’ll first look at strings, lists, dictionaries, loops, functions, and data maps. After mastering these, you’ll take a deep dive into various Python libraries, including pandas, NumPy, Matplotlib, seaborn, and Plotly. You’ll wrap up with guided projects to clean, analyze, and visualize unique datasets using these libraries.
By the end of this course, you will be proficient in data science, including data management, analysis, and visualization.
ABOUT THE AUTHOR

Dr. Junaid Qazi
Dr. Junaid Qazi is a subject matter specialist, data science, machine learning and blockchain consultant. He is a team builder, advisor, professional development coach, mentor, author, technical writer, and invited speaker in his domain of expertise.
Trusted by 3 million developers working at companies
A
Anthony Walker
@_webarchitect_
E
Evan Dunbar
ML Engineer
S
Software Developer
Carlos Matias La Borde
S
Souvik Kundu
Front-end Developer
V
Vinay Krishnaiah
Software Developer
Built for 10x Developers
No Passive Learning
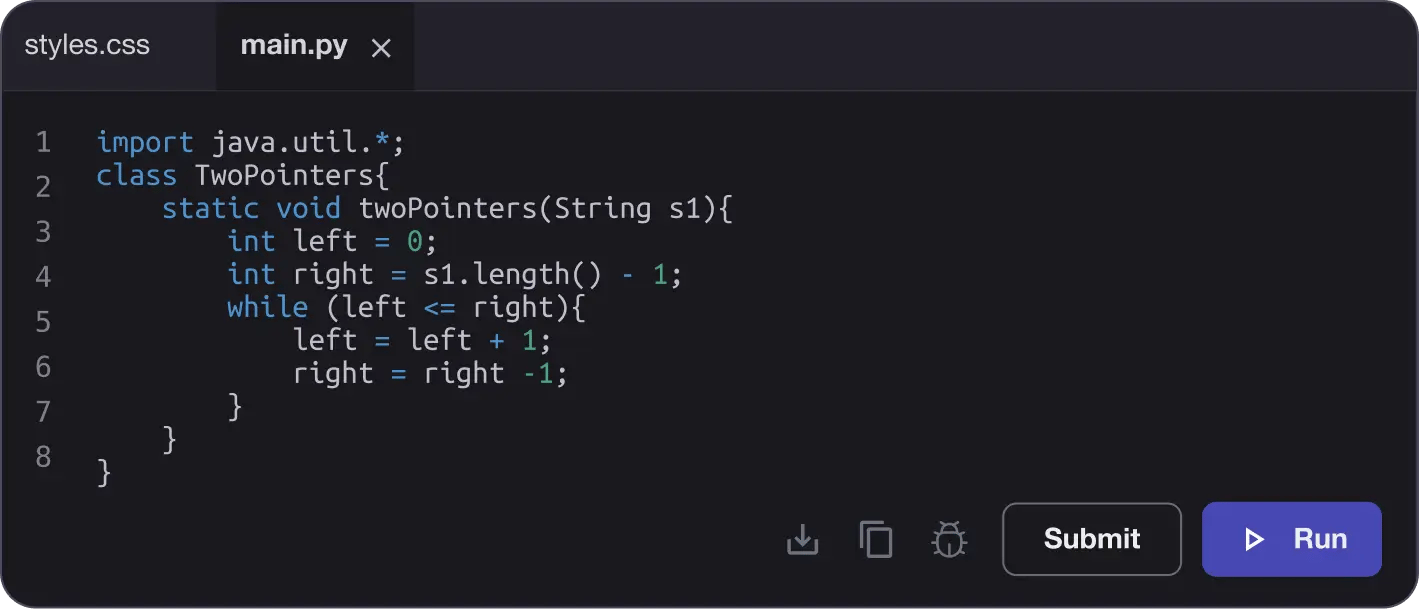
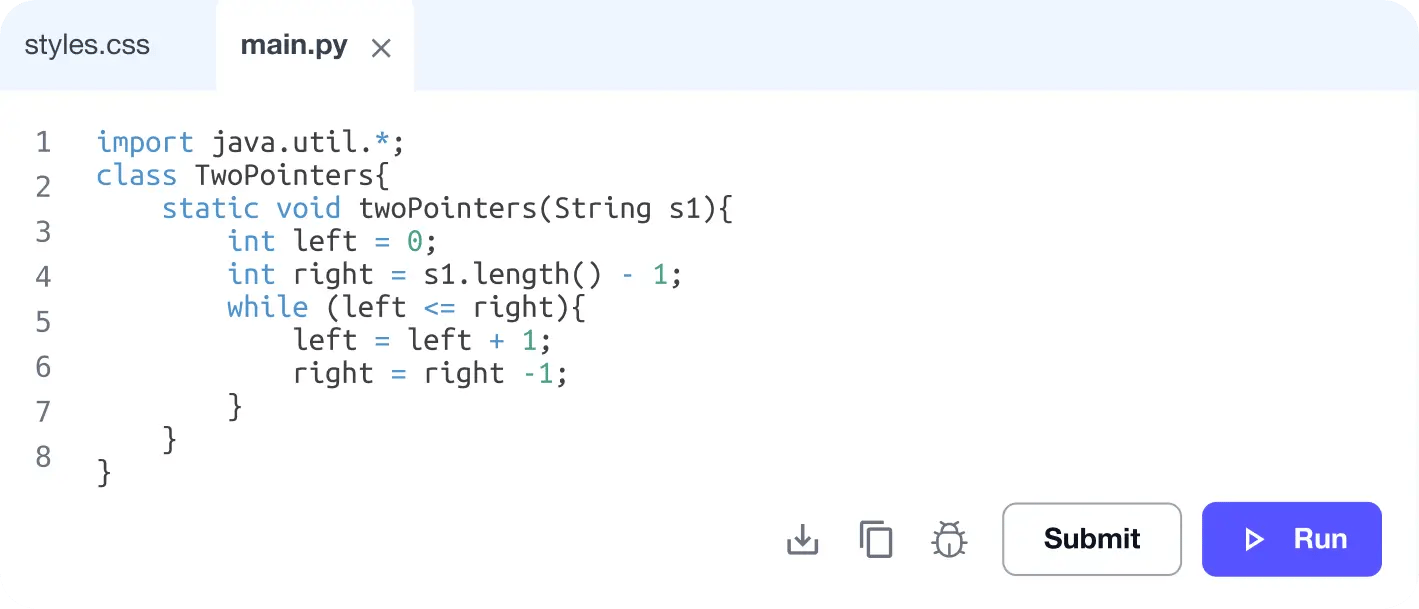
Learn by building with project-based lessons and in-browser code editor
Personalized Roadmaps
The platform adapts to your strengths & skills gaps as you go
Future-proof Your Career
Get hands-on with in-demand skills
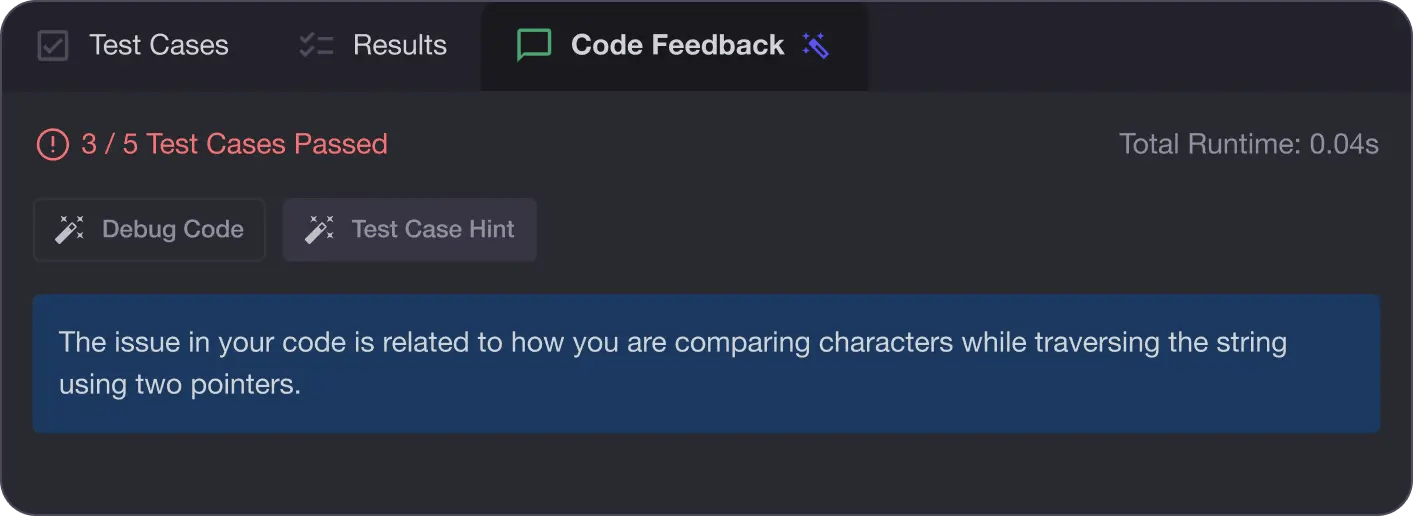
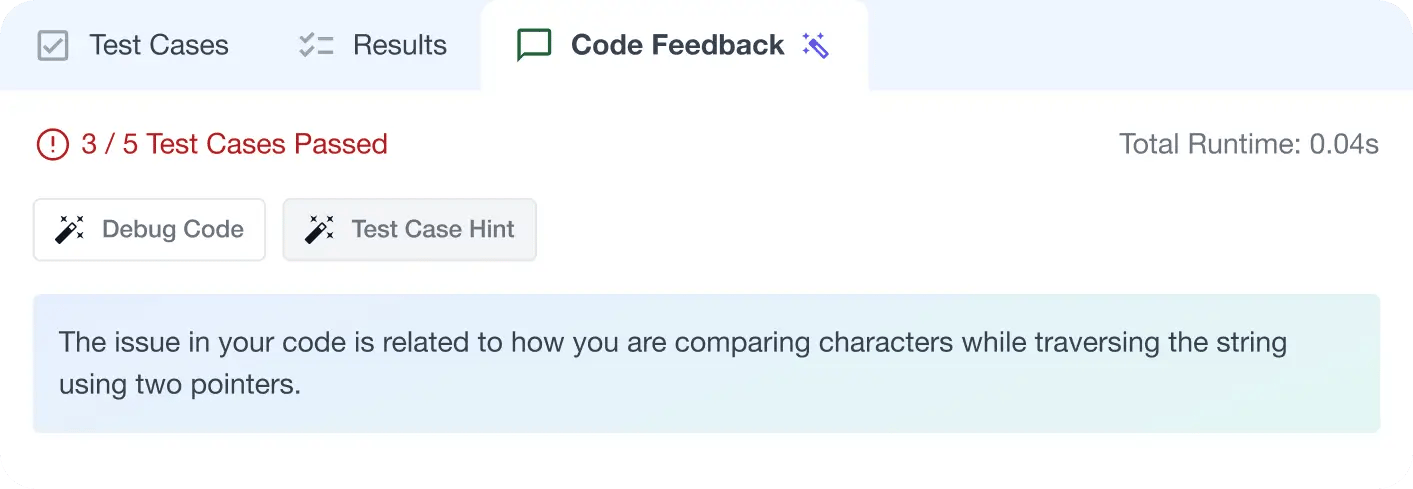
AI Code Mentor
Write better code with AI feedback, smart debugging, and "Ask AI"
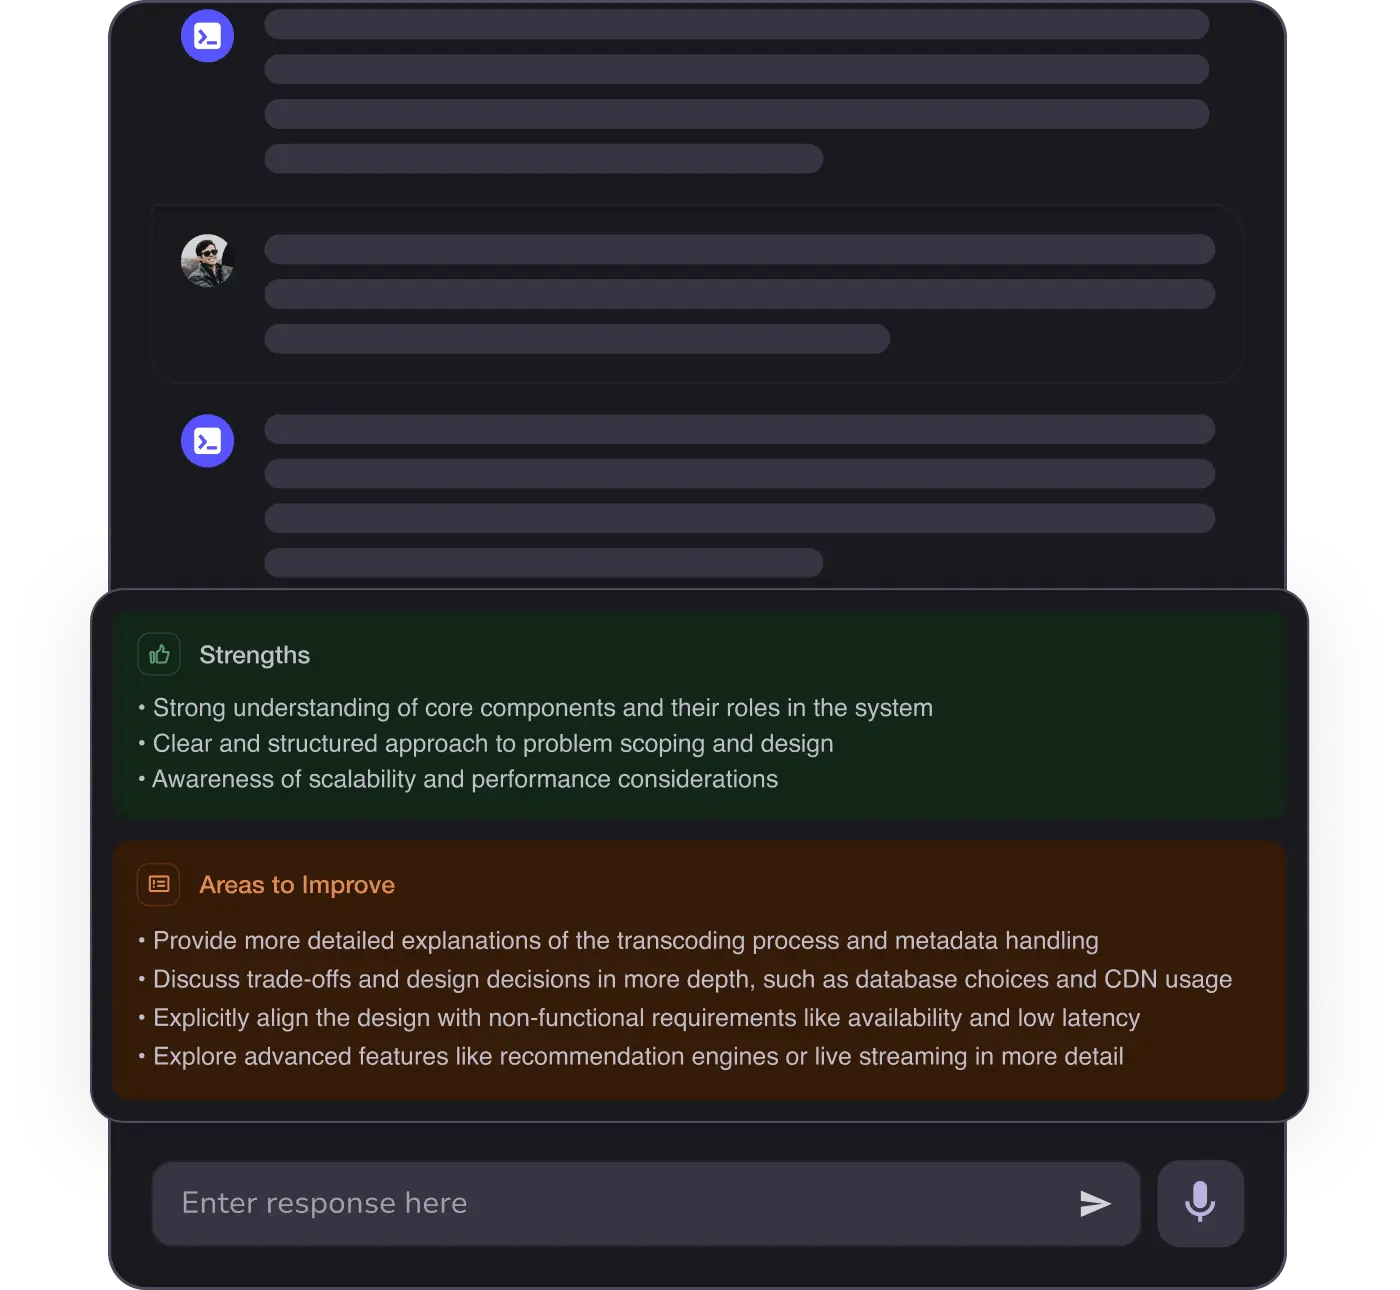
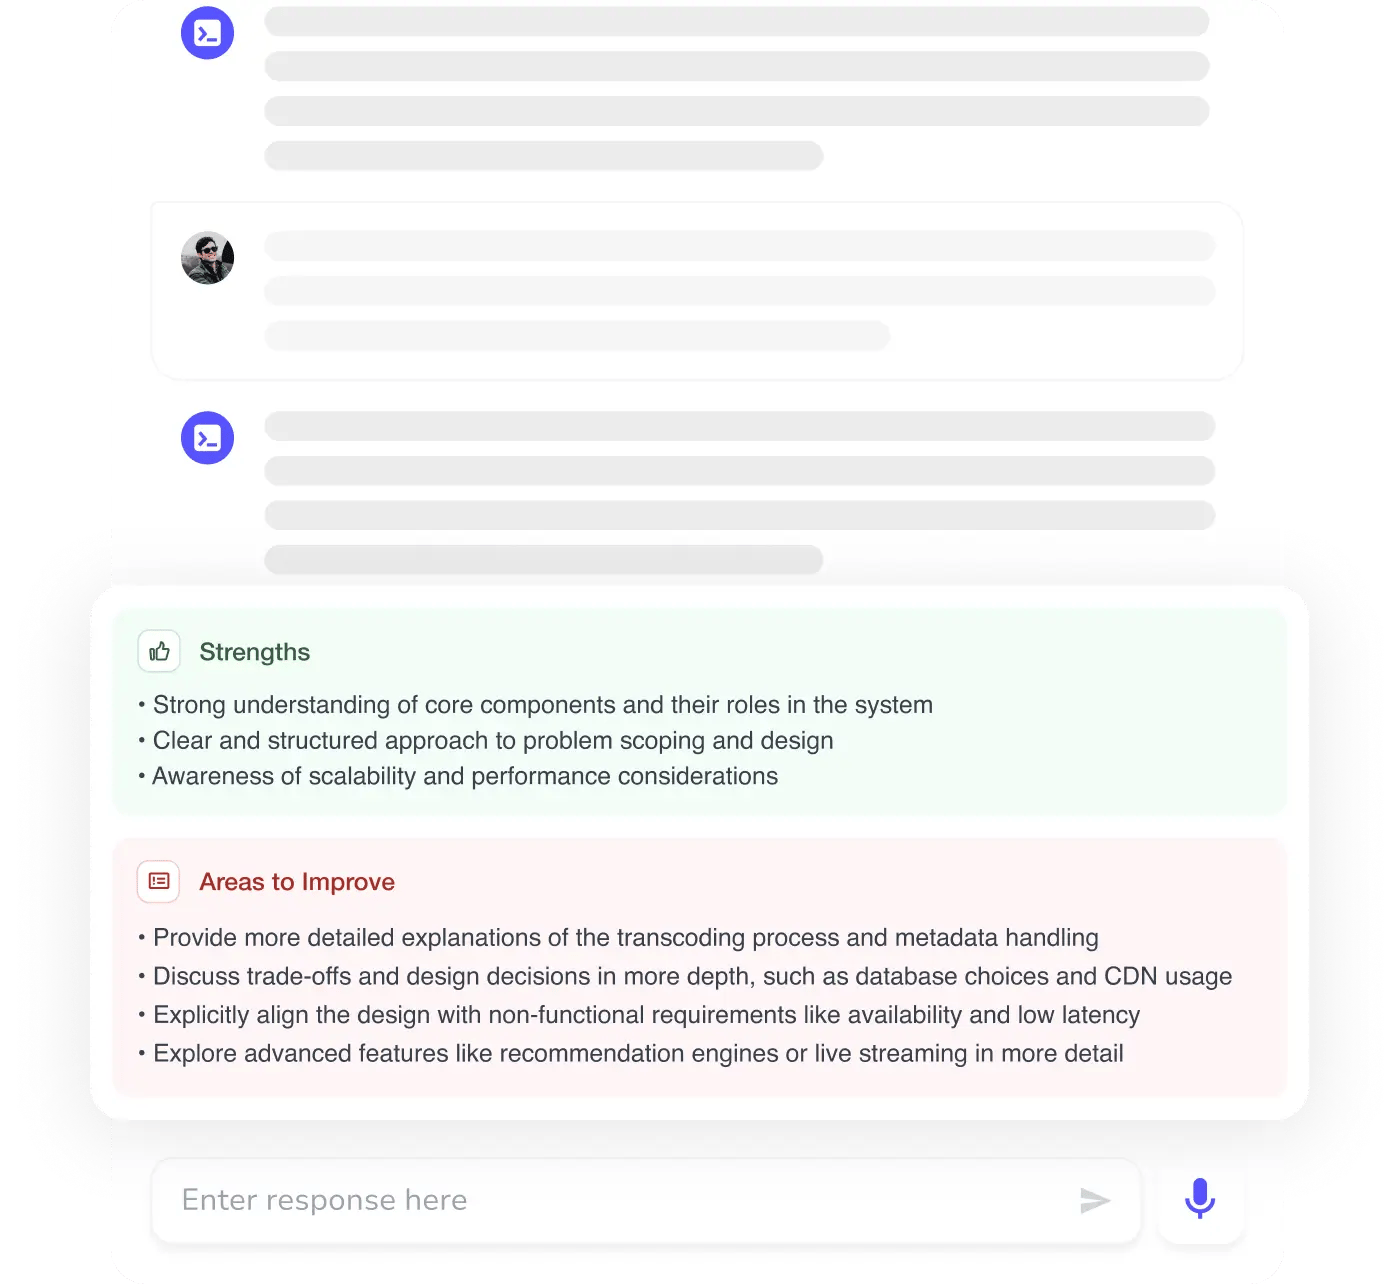
MAANG+ Interview Prep
AI Mock Interviews simulate every technical loop at top companies
Free Resources
