AI-powered learning
Save this course
Python Data Analysis and Visualization
Delve into Python data analysis and visualization using NumPy, SciPy, Pandas, and Seaborn. Gain insights into reading, cleaning, and visualizing data to generate actionable insights.
34 Lessons
2h 30min
Updated 2 months ago
Join 3 million developers at
Join 3 million developers at
LEARNING OBJECTIVES
- Use Python basics (lists, functions, imports) to support data analysis workflows
- Apply core data structures and control flow to organize and manipulate datasets
- Manipulate arrays with NumPy for dot products, sampling, shuffling, and reproducible randomness
- Compute correlations, p-values, and descriptive stats using SciPy statistical functions
- Read CSV, JSON, and raw text files into Python/Pandas for analysis
- Describe and reshape data in Pandas using groupby, pivot_table, and crosstab
- Clean data by handling missing values, outliers, scaling, and encoding categorical variables
Learning Roadmap
1.
What is Analytics
What is Analytics
Get familiar with transforming raw data into actionable insights using Python.
2.
Python Basics for Analytics
Python Basics for Analytics
Walk through Python basics, key data structures, control flow, Numpy, and Scipy usage.
3.
Reading Data
Reading Data
5 Lessons
5 Lessons
Examine reading data from CSV, JSON, raw files, and using Pandas for dataset analysis.
4.
Describing Data
Describing Data
4 Lessons
4 Lessons
Grasp the fundamentals of data analysis and reshaping in Python using Pandas.
5.
Cleaning Data
Cleaning Data
6 Lessons
6 Lessons
Take a closer look at handling missing data, outliers, scaling, and encoding categorical data.
6.
Visualizing Data
Visualizing Data
10 Lessons
10 Lessons
Focus on Python data visualization using Matplotlib and Seaborn for comprehensive data analysis.
Certificate of Completion
Showcase your accomplishment by sharing your certificate of completion.
Complete more lessons to unlock your certificate
Developed by MAANG Engineers
ABOUT THIS COURSE
This course assumes no prior experience and can teach anyone how to use Python to analyze and visualize data. Stop using Excel and start harnessing the power of Python.
Data analysis is one of the hottest careers of the 21st century. As an analyst, your goal is to peel back layers of data in order to answer questions of interest; that is the power of analytics. It allows you to take raw data and create meaningful, actionable insights.
In this course, you’ll learn how to use Python, NumPy, SciPy, Pandas, and Seaborn to perform data analysis and visualization. You’ll explore the four crucial steps for any data analysis project: reading, describing, cleaning, and visualizing data. In each step, you will work with the most common and popular tools that data analysts use every day. By the end of the course, you will be able to confidently extract knowledge and answers from data.
ABOUT THE AUTHOR

Tyler Folkman
Head of AI at Branded Entertainment Network. Passionately pursuing great science, leadership and helping others along the way.
Trusted by 3 million developers working at companies
A
Anthony Walker
@_webarchitect_
E
Evan Dunbar
ML Engineer
S
Software Developer
Carlos Matias La Borde
S
Souvik Kundu
Front-end Developer
V
Vinay Krishnaiah
Software Developer
Built for 10x Developers
No Passive Learning
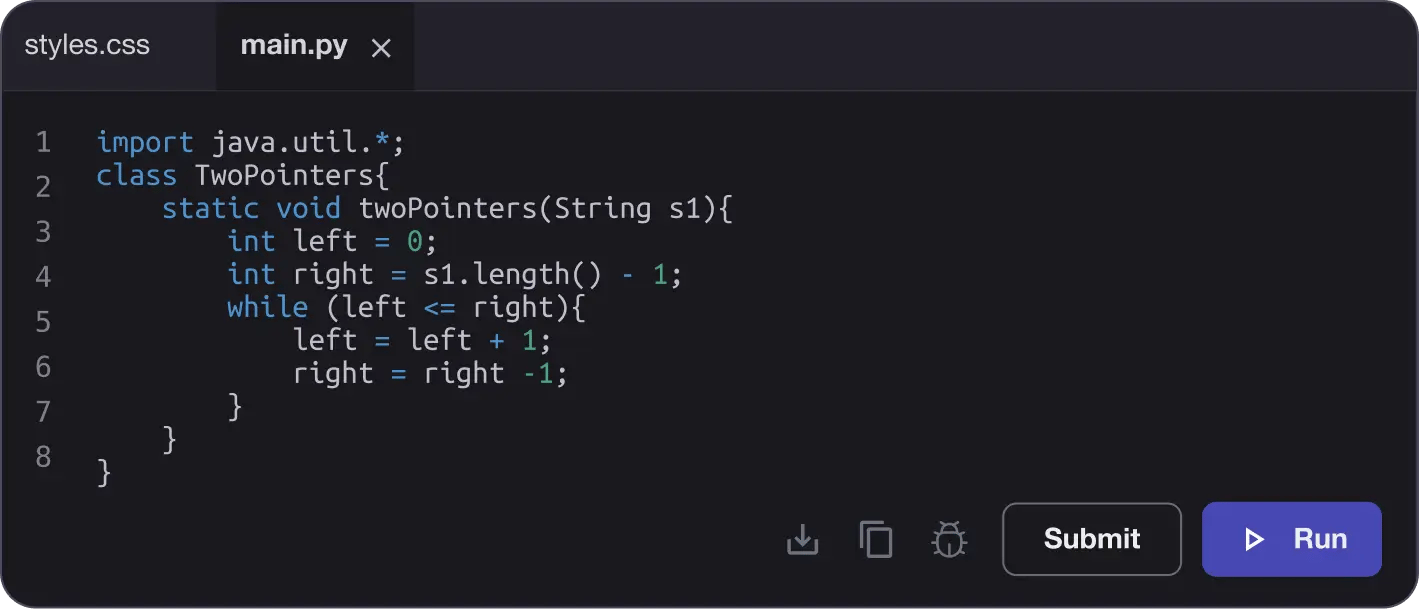
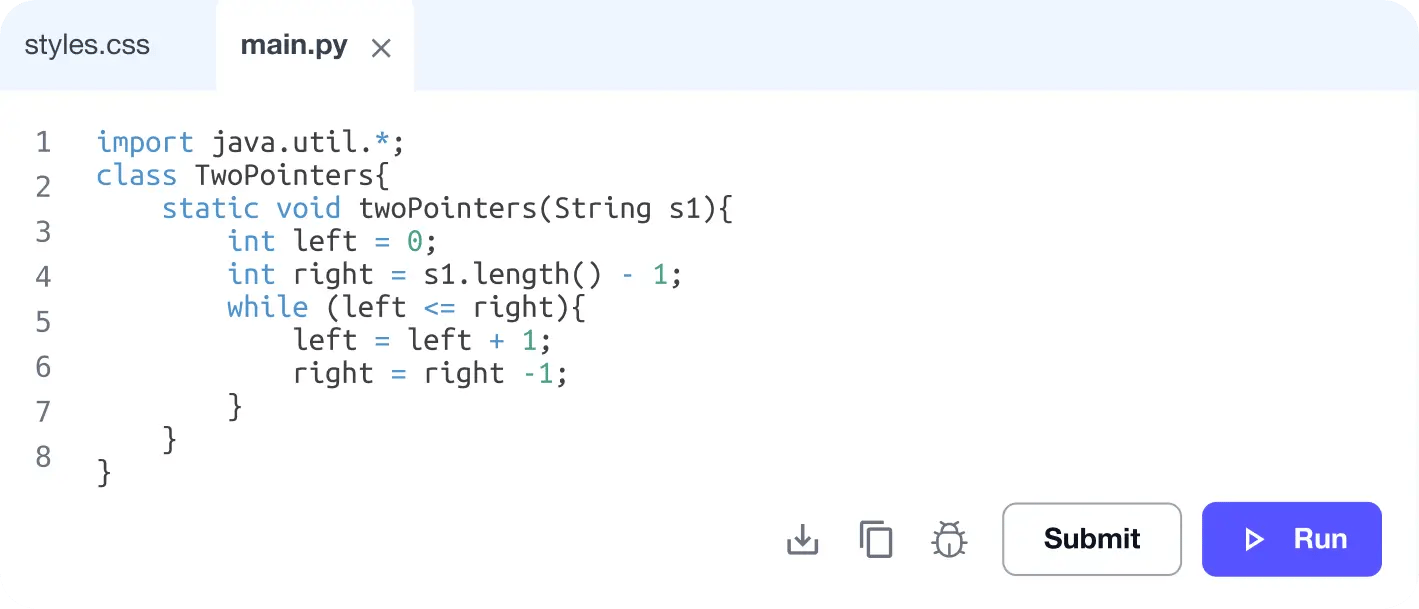
Learn by building with project-based lessons and in-browser code editor
Personalized Roadmaps
The platform adapts to your strengths & skills gaps as you go
Future-proof Your Career
Get hands-on with in-demand skills
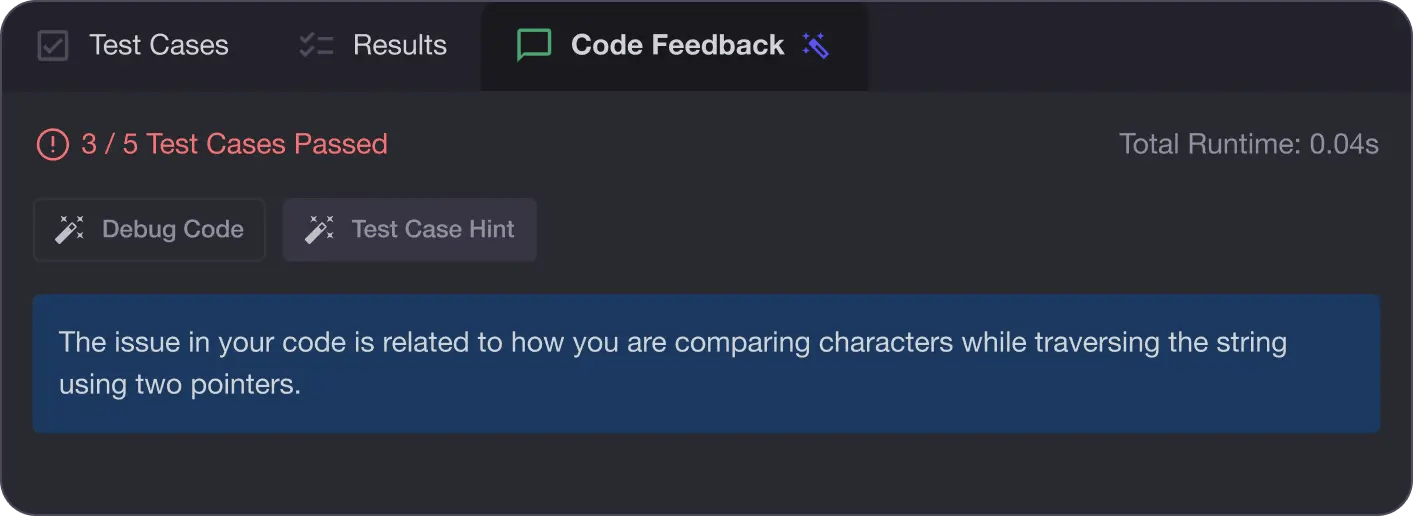
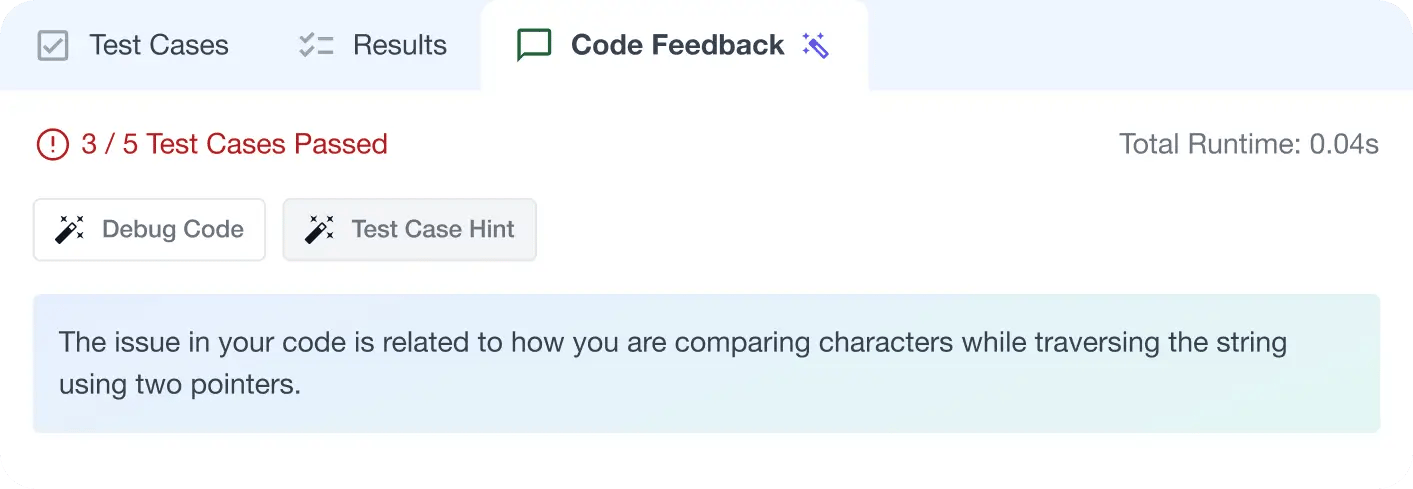
AI Code Mentor
Write better code with AI feedback, smart debugging, and "Ask AI"
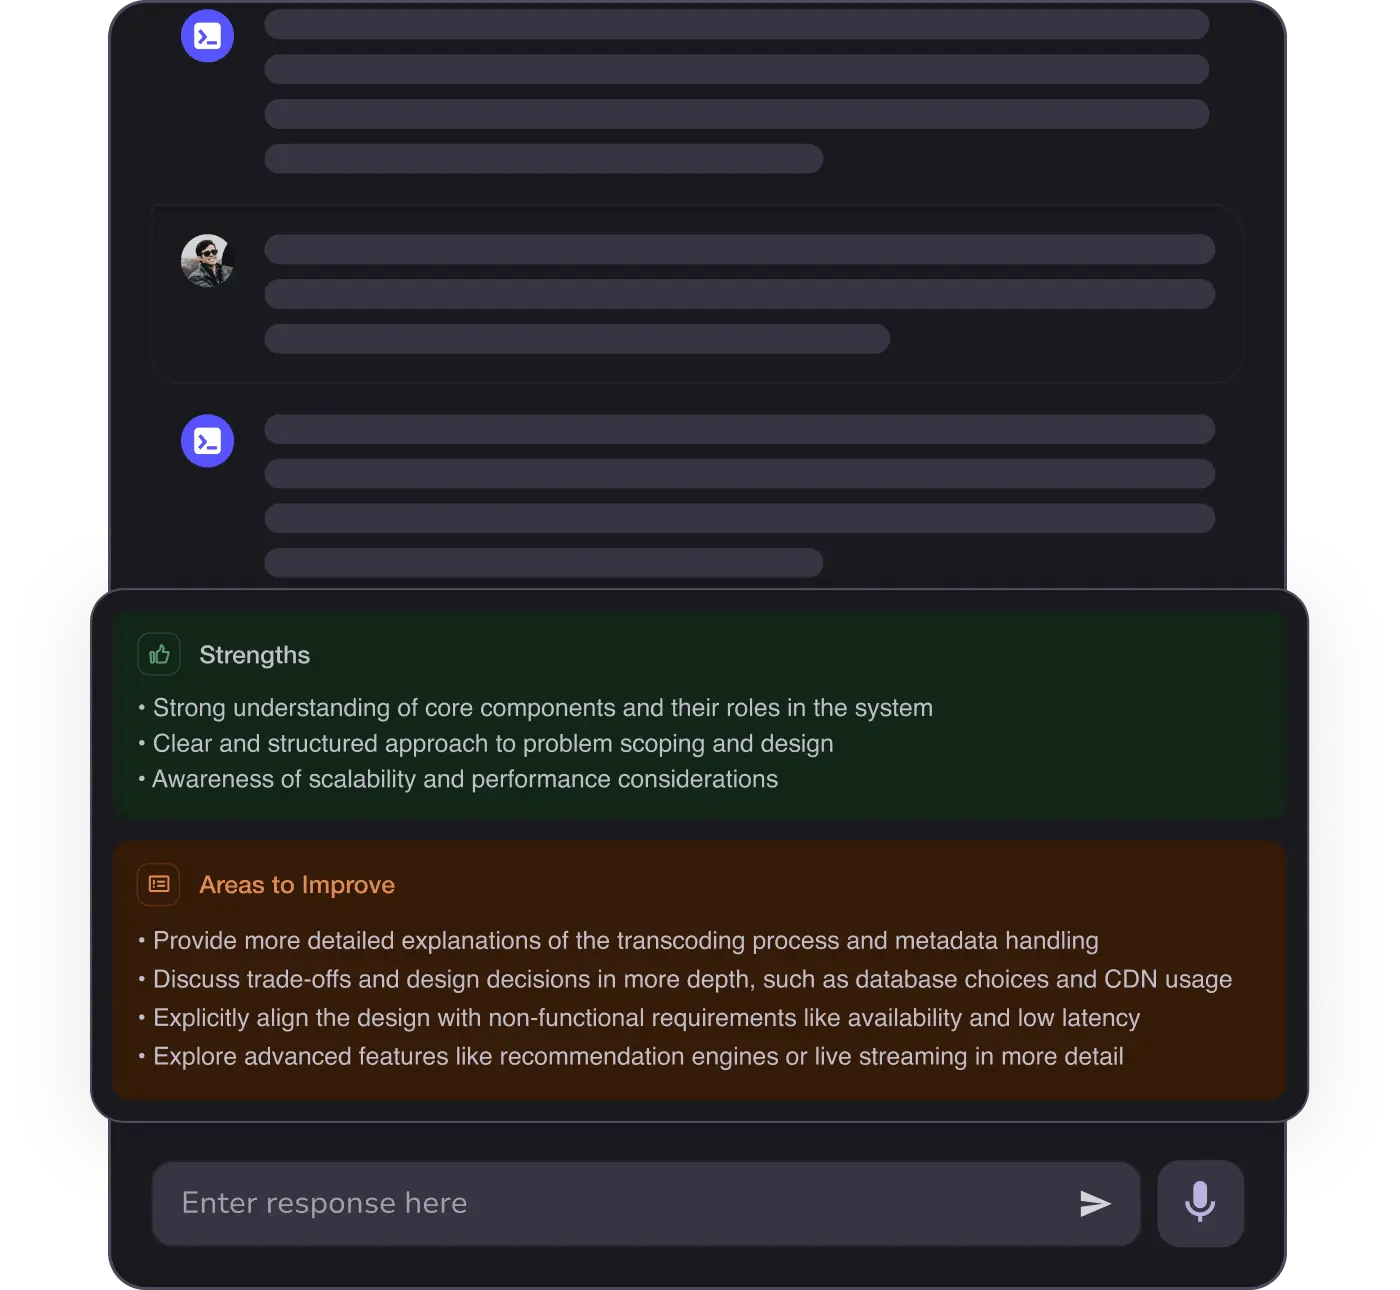
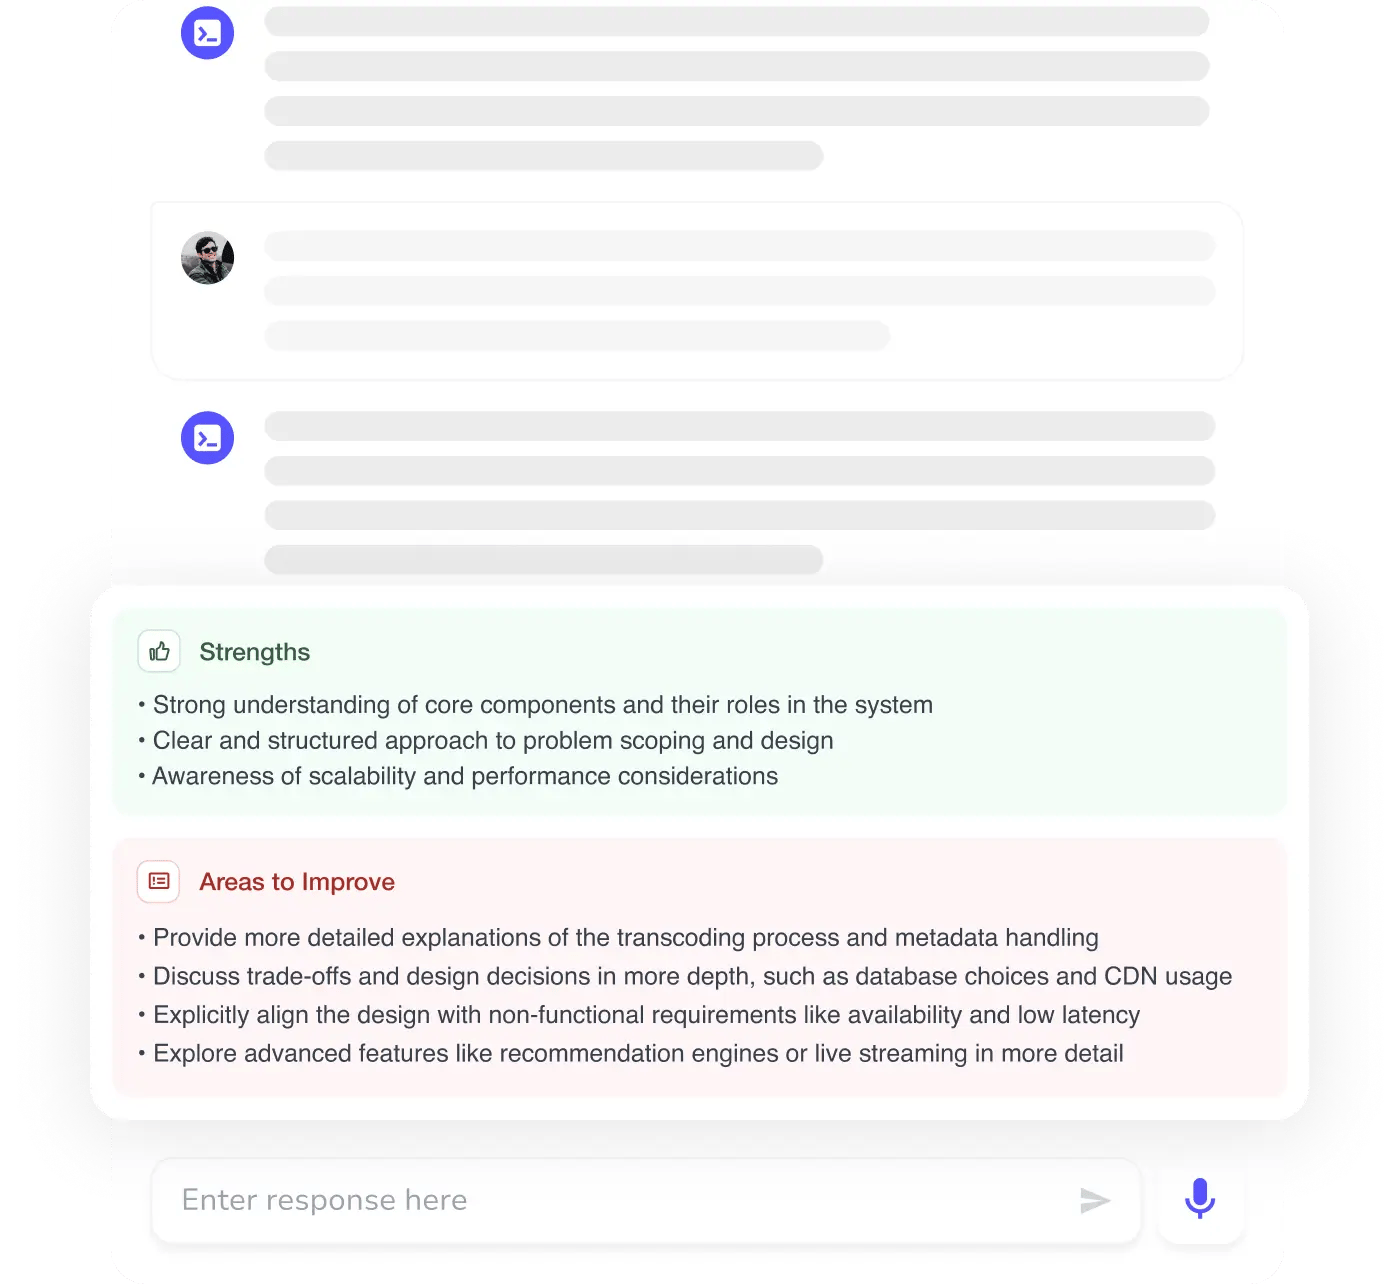
MAANG+ Interview Prep
AI Mock Interviews simulate every technical loop at top companies
Free Resources
