How can you automate performance testing with Gatling and Jenkins
Performance testing is an integral step in the lifecycle of company applications and products. Amplifying speed, scalability, automated performance tests allows stakeholders to identify all kinds of obstacles in their applications and ensure a smooth user experience. Performance testing is in high-demand across the industry, and it’s a valuable, competitive skill you can add to your resume or profile.
If you’re looking to expand your understanding of performance testing, this article is for you. Today, we will go over the basics of performance testing and teach you the in-demand tools for automated testing: Gatling and Jenkins.
Learn the industry-standards for performance testing
Gain the necessary fundamentals of Gatling, Jenkins, and Lighthouse to run automated tests smoothly, including scalability testing and stress testing.
Performance Test Automation 101: Gatling, Lighthouse, & Jenkins
What is performance testing?#
Performance testing is a comprehensive process of checking for the speed, stability, response time, reliability, and resource usage of a program or product under various workloads. Performance testing allows you to identify and eliminate potential performance bottlenecks in your software.
Typically, performance testing is done through a series of quantitative tests done in a lab or a production environment. To identify bottlenecks, the typical parameters used are processing speed, data transfer rate, network bandwidth, workload efficiency, and reliability.
There are five main types of performance testing that can be used to improve different facets of an application’s performance.
- Load testing: Checks if the software can perform optimally under the expected number of users. The objective is to identify areas of performance bottlenecks and fix them before the application is live.
- Stress testing: Checks for the maximum breaking point of an application. This involves utilizing extreme workloads and high traffic to test when an application breaks.
- Soak testing: Also known as endurance testing, soak testing simulates a steady increase in users over time to test for the system’s long-term sustainability.
- Spike testing: Tests the system’s performance under a sudden large spike in users.
- Volume testing: Tests for the system’s performance under varying database volumes by populating a large amount of data and monitoring the overall software system.
Performance testing for cloud-native and serverless systems#
Traditional load testing focuses on monolithic web servers, but many modern systems are composed of microservices, containers, and serverless functions. These architectures introduce new performance considerations that your tests should reflect.
Key scenarios to include in modern performance tests:
-
Cold starts and concurrency: Measure how quickly serverless functions (like AWS Lambda or Azure Functions) respond when scaling up from zero.
-
Autoscaling behavior: Simulate gradual and sudden traffic spikes to ensure Kubernetes pods, containers, or cloud services scale predictably.
-
Network latency and inter-service calls: Many performance issues occur in the communication between microservices — not just in individual endpoints.
-
Resource throttling and limits: Test how the system behaves when CPU, memory, or bandwidth resources are constrained.
By incorporating these cases into your testing plan, you’ll get a clearer picture of how your system behaves under real-world production conditions.
Why do we need performance testing?#
Performance testing allows stakeholders to identify bottlenecks within software. A bottleneck is a single point that holds back the overall performance of an application. By identifying bottlenecks, you can highlight areas where the application might fail or lag.
With performance testing, you can identify where the software needs to improve before going public. And without it, applications could face a series of issues, such as slow runtime or inconsistencies across operating systems.
Without performance testing, we encounter all sorts of issues in our code and products, including poor response time, long load time, poor scalability, and bottlenecks.
Performance testing metrics#
Organizations use KPIs (key performance indicators) to evaluate the performance of their software during performance testing. Here are some common metrics:
- Throughput: Number of units of information a system processes over a timespan.
- Memory: The storage space available to a workload Bandwidth: the volume of data per second to move between workloads
- Latency: Amount of time between a user request and the start of a system’s response.
- CPU interrupts per second: The average number of hardware interrupts that a process receives.
- Miscellaneous Private bytes, page faults, disk queue length, maximum active sessions, network bytes total per second.
Performance testing tools#
Now that, we understand the basics of performance testing, let’s learn about the most widely used open-source performance testing tools. In this article, we will learn about Gatling and Jenkins, but it’s important to know what else is out there.
Gatling
Gatling is a load testing tool that uses Akka actors to simulate a large load of users. These tests are written in Scala and use DSL. Gatling is designed for ease of use, high performance, and maintainability. Gatling is a widely popular tool for load testing, with more than 5 million downloads and thousands of companies using it for testing. Gatling offers free versions and a paid enterprise version.


Locust
Locust is an open-source load testing tool written in Python. Locust is distributed and scalable, so it can support a large load of simultaneous users over multiple machines. With Locust, you can define user behavior in code, so there is no need for clunky UIs or XML. In a locust test, a “swarm” of locusts attacks your target site. Each locust’s behavior is configurable, and you can monitor the swarm in real-time.
Jmeter
Jmeter is an open-source load and performance testing tool written in Java. It supports a variety of applications, servers, and protocols including HTTP, TCP, SOAP, Web, LDAP, etc. It is one of the most popular performance testing tools available.


Lighthouse
Lighthouse is used for measuring website performance. It is an open-source, automated tool used to improve the quality of web pages. It offers audits for performance, accessibility, PWAs, SEO, and more. Once you give Lighthouse a URL, it will run audits against the page and generate a report. The metrics can can be used to improve the site.
Modern performance testing tools and trends#
While Gatling remains a powerful and widely used load testing tool, the performance testing ecosystem has evolved significantly in the past few years. Teams now have more options for automating and scaling their tests across modern infrastructure. Here are some tools and approaches worth exploring alongside Gatling:
k6: A developer-friendly load testing tool written in Go with a simple JavaScript API. It’s easy to script, containerize, and integrate into CI/CD pipelines.
Artillery: A lightweight alternative ideal for API and microservices testing, supporting both HTTP and WebSocket workloads.
Locust: A Python-based framework that’s highly extensible and great for custom scenarios or integrating with data generation pipelines.
Cloud-based load testing services: Tools like BlazeMeter, Flood.io, and Loadster allow distributed tests from multiple regions with minimal setup, making them ideal for global-scale applications.
Most teams use a combination of tools today — Gatling for JVM-based performance scripting, k6 for developer-friendly testing, and a SaaS solution for global load distribution.
Automated Testing with Gatling#
In the world of software, there are two kinds of testing: manual and automated. The process that we introduced to you above is for the most part, manual. Test automation involved running tests automatics, managing the test data, and utilizing the results to improve your software quality.
This is typically achieved by writing scripts and using automation testing tools like Gatling, a highly capable load testing tool. The architecture of Gatling is asynchronous as long as the underlying protocol, such as HTTP/HTTPS, is implemented in a non-blocking way.
This architecture allows us to utilize virtual users instead of using dedicated threading. Therefore, running thousands of concurrent virtual users is no problem compared to a thread-based load testing tool like JMeter.
Features of Gatling#
- Rich utilities: Gatling offers a collection of utilities and supports passing test data to load test scenarios from CSV, TSV, JSON, SSV, and Redis.
- UI Recorder: Gatling offers a standalone recorder able to convert HTTP web actions to Gatling test scripts.
- Akka Actors: Gatling uses Aka Actors so that the virtual users make non-block requests, providing maximum efficiency.
- Web Sockets & JMS support Gatling provides support for JMS (Java Message Service), SSE (Server-Side Events), Web Sockets, and MQTT (MQ Telemetry Transport).
- Assertions: Gatling provides assertions and checks that can be performed on the received response.
- Rich HTML report: Gatling provides a feature-rich HTML report, which contains information about the executed scenario, configuration, and statistics about the response.
- Integration with Grafana & StatsD: Gatling also provides ways to persist the execution report by exporting the results to Graphana, Influx Time Series Database, StatsD, etc.
- Jenkins CI/CD integration: Gatling allows us to override the run configuration parameters at runtime, including the reporting configurations. This allows us to easily integrate with CI/CD pipelines.
- Distributed load testing: Gatling allows us to run test scripts against multiple servers that are behind load balancers by distributing the load and making configuration changes.
Gatling Stress Test Simulation#
Stress testing, also known as endurance testing, verifies the system’s error handling capability and its reliability under extreme, prolonged conditions.
Sample:
In the example below, we send requests to Api coingecko to fetch the cryptocurrency derivatives.
Create the global HTTP configuration
In the code snippet below, we can create a global HTTP configuration:
- Disabling caching
- Disabling initial warm-up
- Setting the base URL for all the HTTP requests
- Setting the default content-type and accepting headers
Keep the learning going.#
Learn performance testing without scrubbing through videos or documentation. Educative’s text-based courses are easy to skim and feature live coding environments - making learning quick and efficient.
Performance Test Automation 101: Gatling, Lighthouse, & Jenkins
Create the user scenario
In the code snippet below:
-
Creates a user scenario containing an HTTP
execfor making a GET request to/api/v2/derivatives/exchanges, in which the base URL is picked up from global HTTP configuration. -
Asserts the status code and checkers whether the
idfields exist in the response.
Set up user injection profile
We create the user injection. In our case, we execute the user scenario at a constant rate of 2 times for 10 seconds. Once the simulation is done, we assert whether the number of failed requests is 0.
Running Gatling from Jenkins#
Continuous Integration (CI) is the first phase of the automated release pipeline. It’s a way to get early feedback on developers’ code changes using an automated test suit. The process:
- Commit code
- Build application source code
- Run automated tests
- Provide feedback
The CI process is set up by using acceptance tests for code changes. Automated performance tests in the CI process can be done using only roughly 5% of the actual load.
This allows us to receive early feedback and evaluate the impact of the newly committed code. If there are any bottlenecks or issues, we can immediately analyze and fix the problem on the spot before going live.
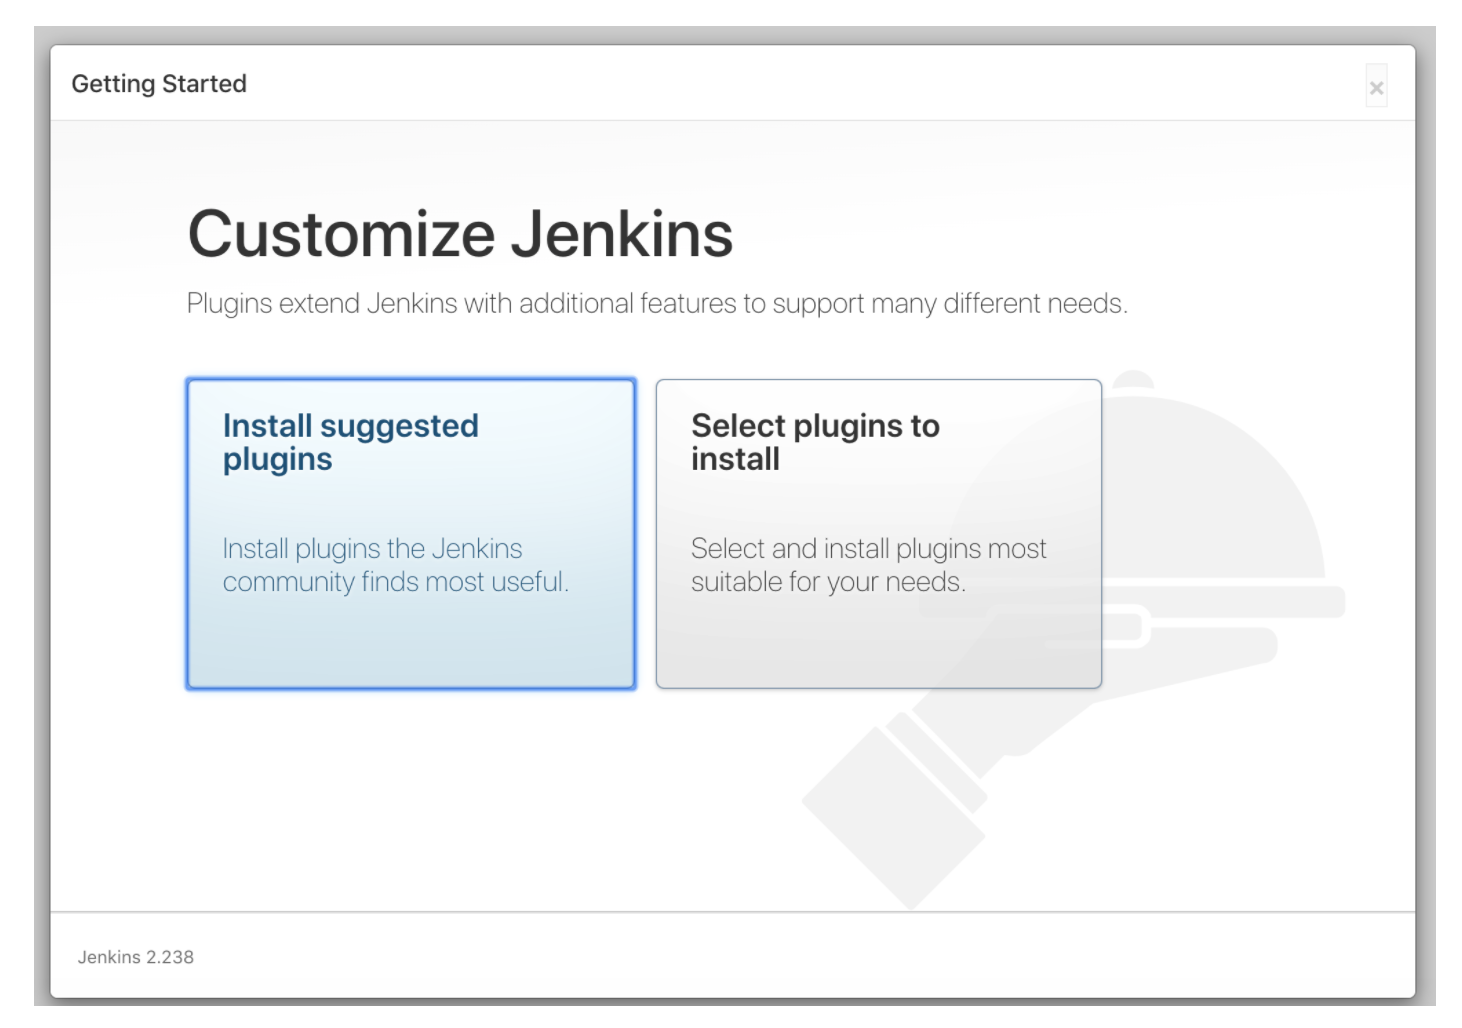
Jenkins setup and install#
The below guide will provide the steps for you to install Jenkins locally or on a remote machine.
- Install the Homebrew package manager
- Install Jenkins
- Start the Jenkins service
- Once the Jenkins service starts, navigate to your browser to https://localhost:8080 to complete the installation.
The screen below will ask you for password to complete your installation along with the password location. Follow the instructions below.
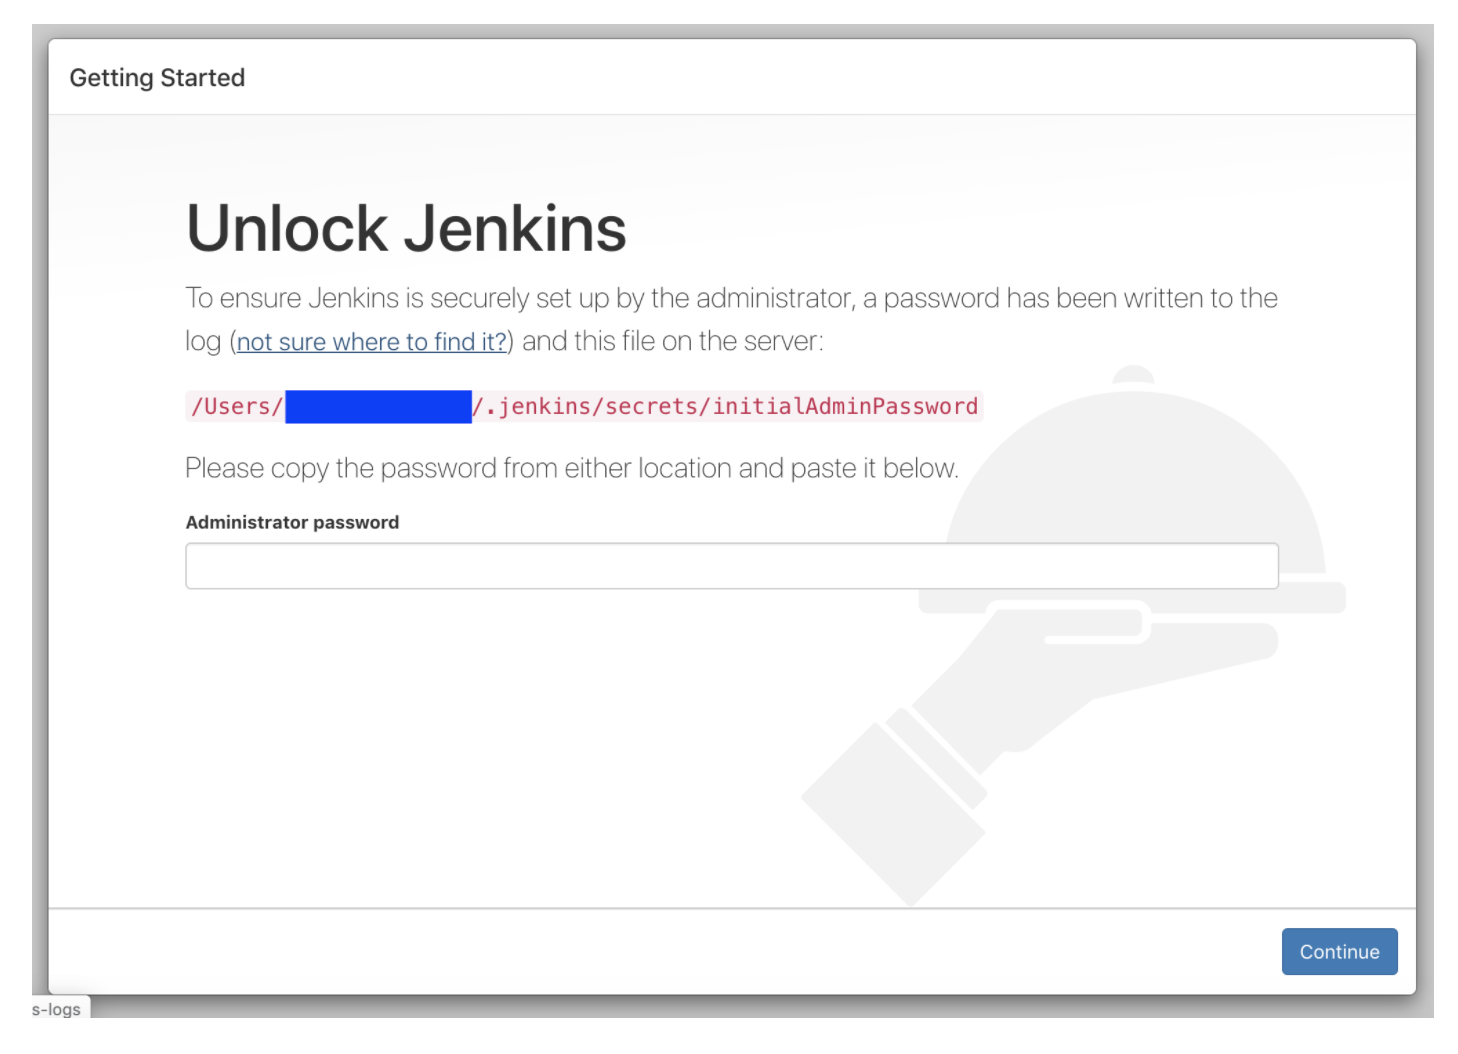
Now Jenkins is set up and ready to be used with Gatling!
Install Gatling Jenkins Plugin#
Follow the below steps to install the plugin.
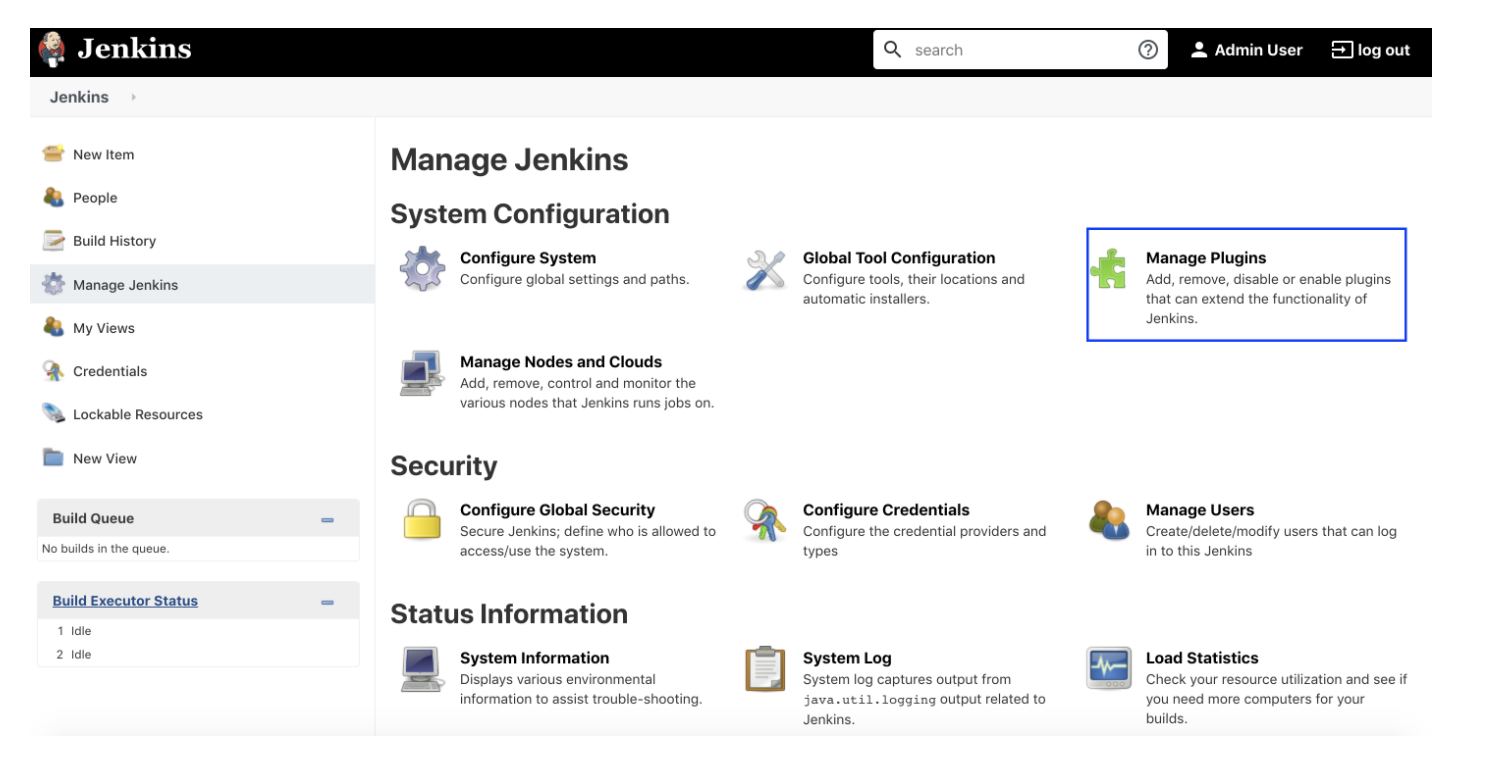
- Login to Jenkins as an admin user.
- Click on the
Manage Jenkinsoption on the left side panel. - Click on
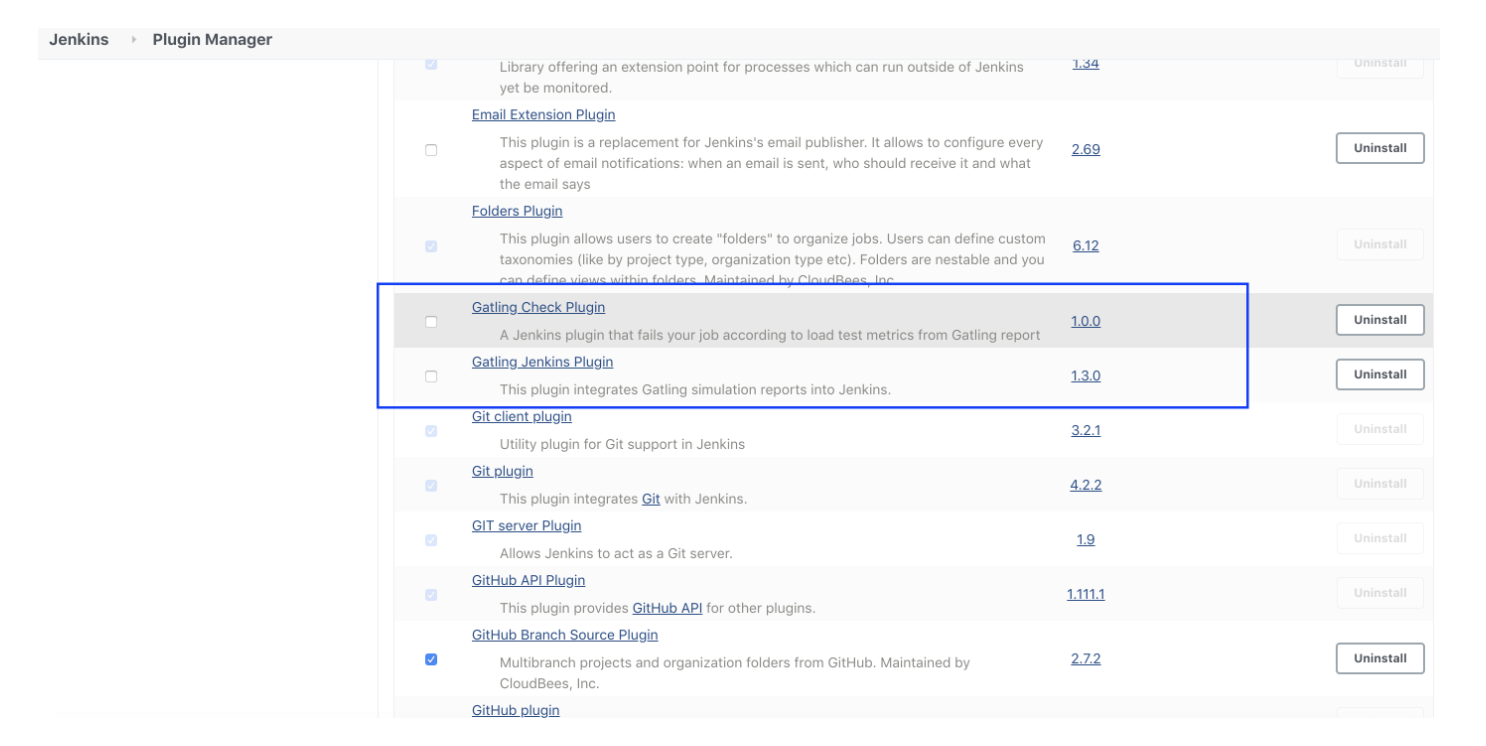
Manage Pluginsoption, as shown below.
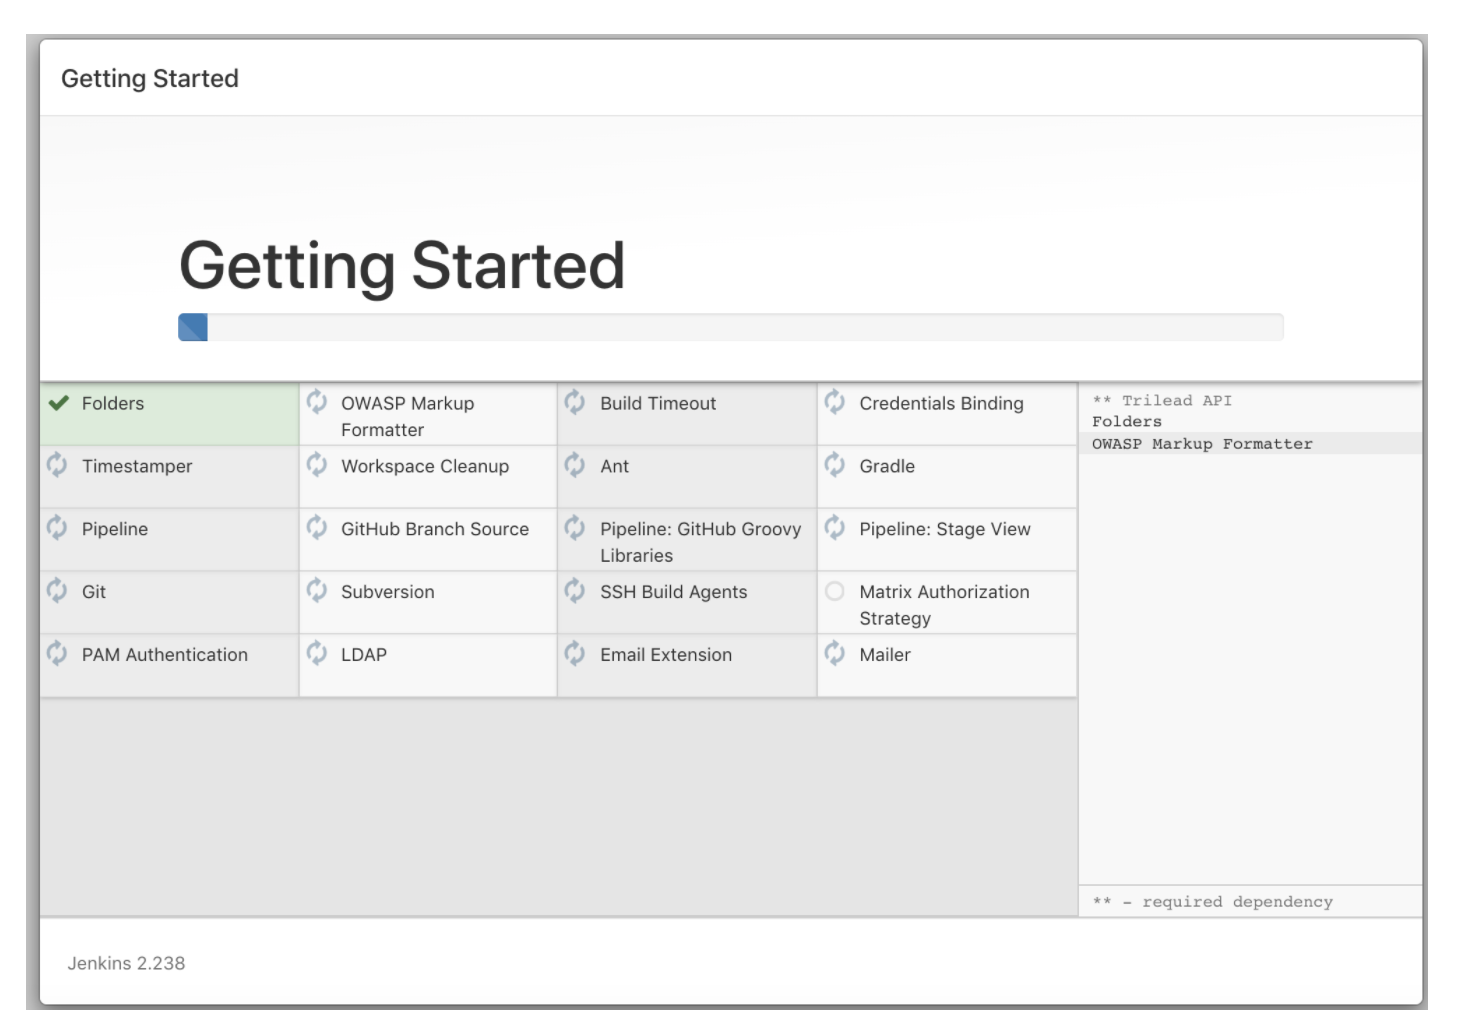
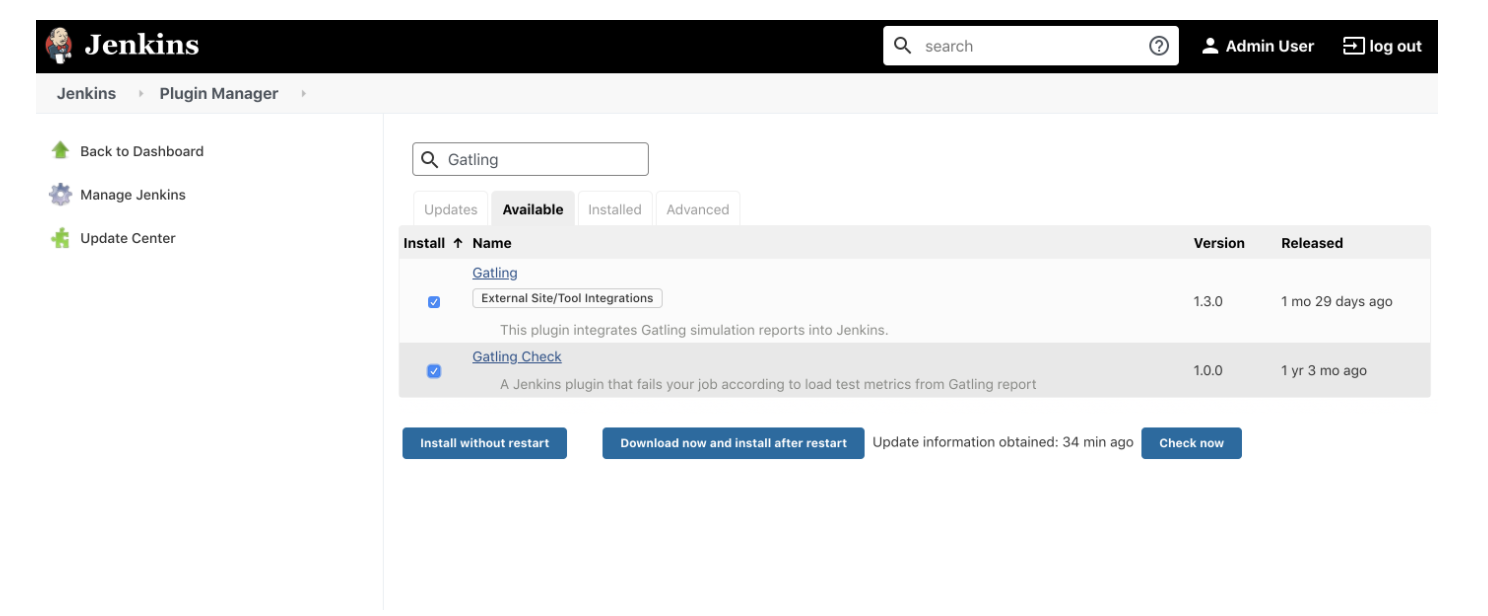
Select the available tab, search for Gatling plugin, select the Gatling plugins, and select the Download now option. Install it after restarting.
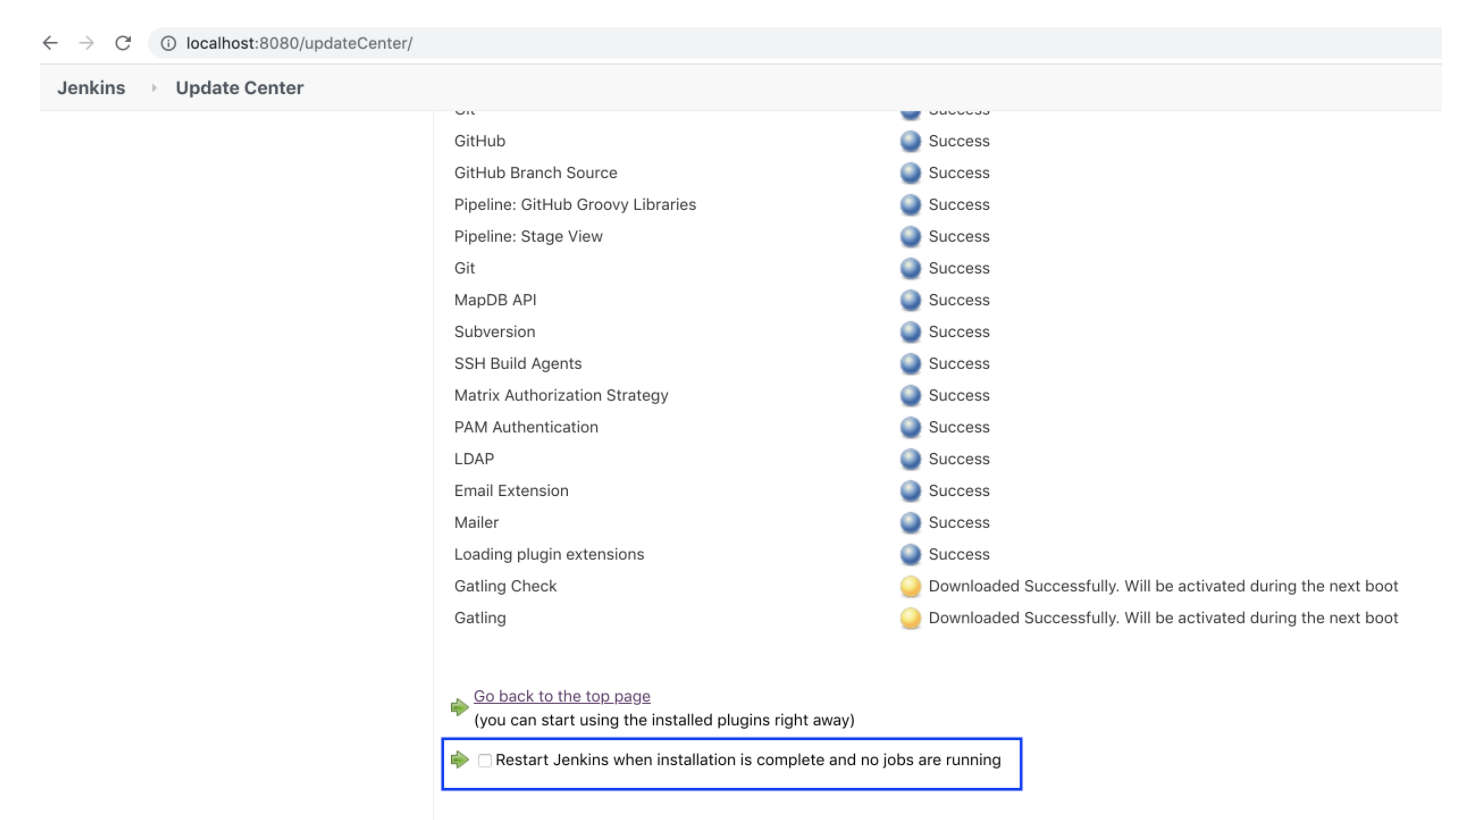
Once the plugin is installed, you can restart from the UI option as shown below or via the command line using brew, as discussed in the previous lesson.
Once the Jenkins is restarted, you can see the Gatling under installed plugins (manage plugins -> installed plugins).
Now we are all set to use the Gatling plugin for creating our load testing job, which can also be used in the CI flow!
Distributed and global load testing#
In 2025, applications are used globally, and performance expectations vary across geographies. Generating load from a single location no longer gives an accurate view of user experience. Distributed load testing solves this by orchestrating load generation from multiple regions or data centers.
Some best practices for distributed testing include:
Use containerized runners: Run Gatling or k6 agents as Docker containers across multiple regions to simulate realistic traffic.
Leverage cloud infrastructure: Spin up ephemeral test runners on AWS, GCP, or Azure to scale tests elastically.
Test from the edge: Include CDN or API gateway endpoints in your test plan to measure latency closer to real users.
This approach ensures your performance benchmarks reflect real-world latency, throughput, and reliability for users around the world.
Observability, tracing, and performance visibility#
Performance testing doesn’t stop at load generation — it’s equally important to understand why your system behaves the way it does. That’s where observability comes in. Integrating your tests with metrics, logs, and traces can help you pinpoint performance bottlenecks and validate optimizations.
Here are some recommended practices:
Use OpenTelemetry to collect traces and correlate them with your load tests.
Send Gatling metrics to Prometheus or InfluxDB and visualize them in Grafana for deeper insights.
Instrument services for distributed tracing so you can see which microservices, database queries, or external calls contribute most to latency.
Define SLIs and SLOs — for example, “99% of requests must complete under 300 ms” — and monitor them automatically.
Combining performance testing with observability ensures you’re not just finding problems, but understanding them.
Integrating with Modern CI/CD Pipelines#
While Jenkins is still widely used, many teams now integrate performance testing into other CI/CD platforms such as GitHub Actions, GitLab CI, CircleCI, and Azure Pipelines.
The core principle remains the same — automate your performance tests as part of your delivery pipeline — but the setup is now simpler and more flexible.
Here’s an example of how you might include a performance test step in a GitHub Actions workflow:
- name: Run performance testsrun: |docker run -v $PWD:/opt/gatling \\gatling/gatling \\-s com.example.MySimulation
This ensures that every new release is automatically tested for performance regressions before deployment to production.
You can also configure thresholds so that the pipeline fails automatically if latency, throughput, or error rates exceed acceptable limits — ensuring that performance remains a core part of your CI/CD quality gates.
Advanced scenarios: Chaos and resilience testing#
Performance testing isn’t only about speed — it’s also about resilience. Modern distributed systems must handle network failures, dependency outages, and resource exhaustion gracefully. Combining performance testing with chaos engineering helps validate how well your system recovers under stress.
Some useful scenarios include:
Latency injection: Introduce artificial delays between microservices to test timeout and retry logic.
Dependency failures: Simulate database or API outages to see how the system responds under load.
Resource exhaustion: Limit CPU or memory to observe how autoscaling and throttling behave.
These tests help ensure that your system not only performs well in ideal conditions but remains reliable when things go wrong.
Automating performance regression detection#
Performance testing becomes far more valuable when integrated into continuous feedback loops. Modern pipelines can automatically compare current test results against previous builds and flag regressions before they reach production.
Some strategies to implement this include:
Defining performance budgets (e.g., max response time, throughput minimum) and failing builds if thresholds are breached.
Using tools like Grafana Alerts or Prometheus Alertmanager to notify teams of degradation.
Storing historical performance data in time-series databases for trend analysis.
By treating performance regressions just like functional bugs, you’ll catch and fix issues earlier — when they’re cheaper and easier to resolve.
What to learn next#
Congratulations! Now, you should have a good idea of performance testing. These skills are super valuable for any company, so adding them to your resume is a sure way to stand out as a candidate.
There’s still a lot to learn! The next steps to master Gatling and performance testing are:
- Writing and running Gatling test scripts
- Automate web page performance (WPP) with Lighthouse
- Simulating network throttling
- Gatling global assertions
- and more
To get started with these concepts and processes, check out Educative’s course Performance Test Automation 101. In this course, you’ll learn the fundamentals of Gatling for scalability testing and stress testing. You’ll then learn how to write Gatling scripts, understand web page performance, and simulate network throttling.
By the end of this course, you will have some new great skills for your resume.
Happy learning!
