Accelerated Linux Core Dump Analysis
Gain insights into debugging Linux process and kernel failures using GDB and crash utility. Delve into memory dump analysis, identifying issues like memory leaks, CPU spikes, and deadlocks.
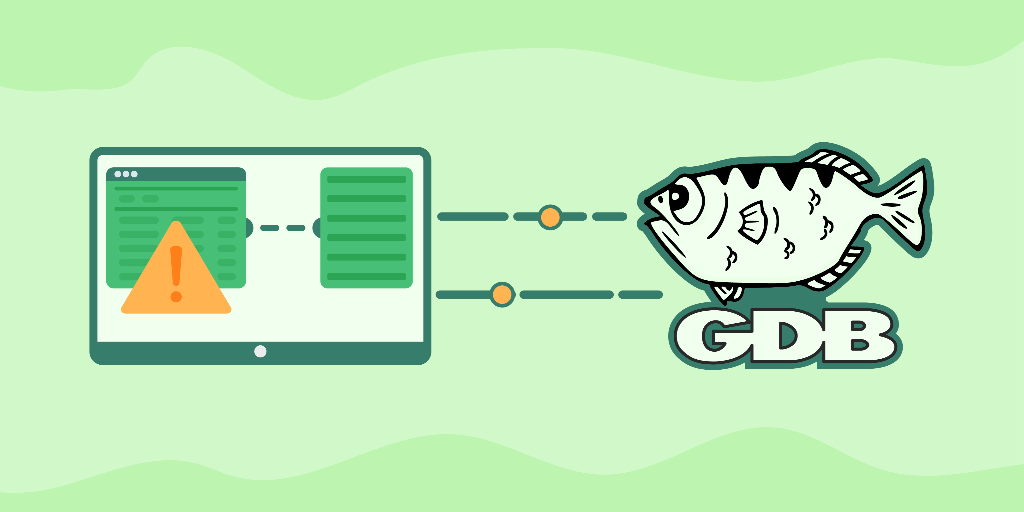
- 53 lessons across 15 modules
- 13 quizzes with instant feedback
- AI Tutor on every lesson
I founded the pattern-oriented software diagnostics discipline (Systematic Software Diagnostics) and Software Diagnostics Institute (DA+TA: DumpAnalysis.org + TraceAnalysis.org), authored more than 50 books on software diagnostics, anomaly detection and analysis, software and memory forensics, root cause analysis and problem solving, memory dump analysis, debugging, software trace and log analysis, reverse engineering and malware analysis. I have more than 25 years of experience in software architecture, design, development, and maintenance in a variety of industries including leadership, technical and people management roles. In my spare time, I explore the mathematical and computer science foundations of Theoretical Software Diagnostics, application of formal logic, artificial intelligence, machine learning and data mining to diagnostics and anomaly detection, Software Narratology, its further development as Narratology of Things and Diagnostics of Things (DoT), Software Pathology, and Quantum Software Diagnostics. My practical focus is on software diagnostics engineering and diagnostics-driven development, diagnostics workflow and interaction. Recent interest areas also include cloud native computing, security, automation, functional programming, applications of category theory to software development and big data, and diagnostics of artificial intelligence.
Join 3.1 million developers at
What You'll Learn
- A working knowledge of how to collect core dumps
- A hands-on knowledge on how to diagnose crashes/hangs via core dump analysis
- The ability to apply pattern-oriented analysis on 64-bit core dumps on x86 architecture
- A familiarity with debugging to diagnose common faults
- The ability to use GDB debugger to analyze Linux process core dump
- An understanding of using the crash utility to analyze Linux kernel core dumps
Learning Roadmap
2.
Fundamentals of Core Dump Analysis
Fundamentals of Core Dump Analysis
3.
Using GDB With Multi-Threaded Applications
Using GDB With Multi-Threaded Applications
5 Lessons
5 Lessons
4.
Null Pointer Patterns and External Debugging Information
Null Pointer Patterns and External Debugging Information
5 Lessons
5 Lessons
5.
Spiking Threads
Spiking Threads
3 Lessons
3 Lessons
6.
Heap Corruption
Heap Corruption
3 Lessons
3 Lessons
7.
Stack Corruption and Overflow
Stack Corruption and Overflow
4 Lessons
4 Lessons
8.
Active Threads
Active Threads
3 Lessons
3 Lessons
9.
Runtime Exceptions and Execution Residues
Runtime Exceptions and Execution Residues
3 Lessons
3 Lessons
10.
Heap Errors
Heap Errors
4 Lessons
4 Lessons
11.
Deadlocks
Deadlocks
2 Lessons
2 Lessons
12.
Post-processing
Post-processing
2 Lessons
2 Lessons
13.
Kernel Dump Analysis with Crash
Kernel Dump Analysis with Crash
7 Lessons
7 Lessons
14.
Wrapping Up
Wrapping Up
2 Lessons
2 Lessons
15.
Appendix
Appendix
2 Lessons
2 Lessons
Dmitry Vostokov
Diagnostician. The Author of Diagnomicon.
Trusted by 3.1 million developers working at companies
Anthony Walker
@_webarchitect_
Evan Dunbar
ML Engineer
Software Developer
Carlos Matias La Borde
Souvik Kundu
Front-end Developer
Vinay Krishnaiah
Software Developer
Built for 10x Developers
Free Resources